Comparative Study
. 2006 Feb 15;20(4):435-48.
doi: 10.1101/gad.1389306. Epub 2006 Jan 31.

Target hub proteins serve as master regulators of development in yeast

Affiliations
Comparative Study

Target hub proteins serve as master regulators of development in yeast

Anthony R Borneman et al. Genes Dev. .

Abstract

To understand the organization of the transcriptional networks that govern cell differentiation, we have investigated the transcriptional circuitry controlling pseudohyphal development in Saccharomyces cerevisiae. The binding targets of Ste12, Tec1, Sok2, Phd1, Mga1, and Flo8 were globally mapped across the yeast genome. The factors and their targets form a complex binding network, containing patterns characteristic of autoregulation, feedback and feed-forward loops, and cross-talk. Combinatorial binding to intergenic regions was commonly observed, which allowed for the identification of a novel binding association between Mga1 and Flo8, in which Mga1 requires Flo8 for binding to promoter regions. Further analysis of the network showed that the promoters of MGA1 and PHD1 were bound by all of the factors used in this study, identifying them as key target hubs. Overexpression of either of these two proteins specifically induced pseudohyphal growth under noninducing conditions, highlighting them as master regulators of the system. Our results indicate that target hubs can serve as master regulators whose activity is sufficient for the induction of complex developmental responses and therefore represent important regulatory nodes in biological networks.


Figures

Figure 1.
Figure 1.
PCR confirmation of factor binding. Three intergenic regions that were shown to be bound by all six factors (iYIR020C, iYKL045C and iYIL119C), in addition to a region shown to be unbound (iYBL055C), were amplified from ChIP samples from either an untagged control strain (WT) or strains containing c-myc-tagged Tec1, Ste12, Sok2, Mga1, Flo8, or Phd1.
Figure 2.
Figure 2.
Tec1, Ste12, Sok2, Phd1, Mga1, and Flo8 bind to discrete sites across all 16 chromosomes of S. cerevisiae. The binding sites for Tec1 (red), Ste12 (blue), Sok2 (yellow), Phd1 (pink), Mga1 (orange), and Flo8 (green) were mapped across the intergenic regions of S. cerevisiae. When binding was observed by multiple factors to the same intergenic region or to closely adjacent regions, diamonds were stacked above each other to ensure visibility. The position of key genes (black text), in addition to those genes whose 5′ regions are bound by all six factors (red text), are indicated below each chromosome.
Figure 3.
Figure 3.
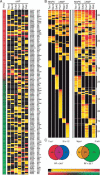
Binding by Tec1, Ste12, Sok2, Phd1, Mga1, and Flo8 correlate with pseudohyphal-expressed genes and also reveal pathway-specific signatures and associated binding pairs. (A) The 131 genes shown to be both regulated during the induction of pseudohyphal growth (Prinz et al. 2004) and bound by Tec1, Ste12, Sok2, Phd1, Mga1, or Flo8. Expression changes are indicated on a red–green log(2) color scale (up-regulated in pseudohyphal cells, red; down-regulated, green). ChIP binding significance is indicated by the red–yellow color scale, (black, binding less than SD = 4 statistical cut-off). (B) The intergenic regions bound by the MAPK factors Tec1 and Ste12 and the cAMP factors Sok2, Phd1, Mga1, and Flo8 were clustered according to the combination of factors that bound to each specific region. Horizontal lines represent intergenic regions, with the probability of binding indicated by the yellow–red color scale. Those regions that were bound by at least one factor are shown on the left, while only those bound by two or more factors were enlarged and are shown to the right. Those combinatorial classes that contain ≥10 intergenic regions are highlighted by the thick black bars. (C) Venn diagrams of the overlap in the intergenic regions bound by Ste12 and Tec1 (left) and Flo8 and Mga1 (right). The RF, which calculates the amount of overlap above that due to random sampling, and the probability for this enrichment are indicated below each Venn diagram.
Figure 4.
Figure 4.
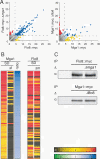
Mga1 requires Flo8 for binding to DNA. (A) ChIP chip was performed on strains containing either Flo8::myc protein in both wild-type and mga1Δ/mga1Δ backgrounds or Mga1::myc protein in both wild-type and flo8Δ/flo8Δ backgrounds The SD values for enrichment of each intergenic region from both of these strains were plotted against each other with the SD = 4 cut-off (dotted lines) used to calculate enrichment in each experiment. Individual intergenic regions were classified as either being enriched in both strain backgrounds (dark blue), enriched only in the mutant strain with >3 SD units difference between strains (red), enriched only in the wild-type strain with ≥3 SD units difference (yellow), or not enriched in either experiment or enriched only in one strain but with <3 SD units difference between experiments (gray). (B, left) Intergenic regions were sorted by the difference in SD values (blue–green scale) obtained from ChIP chip experiments using MGA1::MYC/MGA1::MYC (Mga1) and MGA1::MYC/MGA1::MYC flo8Δ/flo8Δ (Mga1 Δf) strains. (Right) The SD values obtained for the same intergenic regions using both FLO8::MYC/FLO8::MYC (Flo8) and FLO8::MYC/FLO8::MYC mga1Δ/mga1Δ (Flo8 Δm) (red–yellow scale), in addition to their ratio (blue–green scale), were also aligned with those of Mga1. (C) Western blot analysis of Flo8::myc and Mga1::myc protein levels in wild-type and mutant strains as indicated. Two-hundred-fifty OD600 units of cells grown under nitrogen-limiting conditions were lysed, immunoprecipitated, and subjected to Western blot analysis using anti-c-myc antibodies (mouse monoclonal 9E10).
Figure 5.
Figure 5.
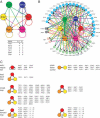
A complex network is formed by the pseudohyphal factors and their downstream targets. (A) The binding network was calculated for Tec1, Ste12, Sok2, Phd1, Mga1, and Flo8. Incoming edges (direction indicated by the arrowhead) represent binding to the promoter region of that factor, while the color of the edge indicates the factor that was shown to bind to this region. The number of outgoing (kout) and incoming edges (kin) for each factor are listed below the network schematic. (B) The binding network for the six factors was expanded by identifying all of the downstream targets that are also transcription factors and then integrating their binding target data into the network (Harbison et al. 2004). Downstream factors are shaded by their major GO term (light blue, transcription; light green, cell growth and/or maintenance; pink, stress; gray, unknown), with their outgoing edges shaded gray. (C) The numbers of five distinct types of simple regulatory patterns in the expanded network (autoregulation, cross-factor control, feedback loops, feed-forward loops, and mixed loops). The members of each class were identified using Mfinder1.1 (Milo et al. 2002) and are listed to the right of each motif diagram. Due to the large number of feed-forward loops observed in the network, the total number of individual patterns are listed below each pattern diagram, with the top six pairs of factors participating in each pattern and their level of occurrence listed (X = any protein).
Figure 6.
Figure 6.
Overexpression of Phd1 and Mga1 induce pseudohyphal growth. (A) Suspensions of diploid cells expressing Tec1, Ste12, Sok2, Phd1, Mga1, and Flo8 from the constitutive ADH3 promoter were plated on SC-URA and incubated for 24 h at 30°C. Colonies were photographed (SC), and then the cells growing on the surface of the plate were removed by gentle agitation, after which the colonies were photographed again (wash). (B) Diploid cells expressing each of the factors used in A were grown for 16 h in liquid SC-URA and then examined microscopically using DIC optics. (C) The log(2) ratios of mRNA levels between either ADH3::MGA1 (X-axis) or AHD3::PHD1 (Y-axis) and the vector control were determined by expression microarray analysis. The ratios obtained for each ORF were plotted against each other to correlate gene expression during the overexpression of the two different factors. ORFs are shaded by their response to overexpression of the factors; twofold or more up-regulation under at least one condition (red), twofold or more down-regulation under at least one condition (green), twofold or more up-regulation under one condition, twofold or more down-regulation under the other (yellow), twofold or less up- or down-regulation (gray). (D) GO category enrichment of genes regulated twofold or more by the overexpression of either Mga1 or Phd1. Individual genes are listed next to their log(2) ratios, determined during overexpression of both Mga1 and Phd1 (red–green scale, bottom), with those also identified as a binding target of Tec1, Ste12, Sok2, Phd1, Mga1 or Flo8 highlighted in bold text. Several genes were found to be members of more than one GO category, and these are indicated as follows: (*) also in “alcohol metabolism”, (†) also in “filamentous growth”.

Similar articles

Cited by

References

    1. Barabasi A.L. and Oltvai, Z.N. 2004. Network biology: Understanding the cell's functional organization. Nat. Rev. Genet. 5: 101–113. - PubMed
    1. Boyle E.I., Weng, S., Gollub, J., Jin, H., Botstein, D., Cherry, J.M., and Sherlock, G. 2004. GO::TermFinder: Open source software for accessing Gene Ontology information and finding significantly enriched Gene Ontology terms associated with a list of genes. Bioinformatics 20: 3710–3715. - PMC - PubMed
    1. Braun T., Bober, E., Buschhausen-Denker, G., Kohtz, S., Grzeschik, K.H., and Arnold, H.H. 1989. Differential expression of myogenic determination genes in muscle cells: Possible autoactivation by the Myf gene products. EMBO J. 8: 3617–3625. - PMC - PubMed
    1. Chae J.H., Stein, G.H., and Lee, J.E. 2004. NeuroD: The predicted and the surprising. Mol. Cell 18: 271–288. - PubMed
    1. Chandarlapaty S. and Errede, B. 1998. Ash1, a daughter cell-specific protein, is required for pseudohyphal growth of Saccharomyces cerevisiae. Mol. Cell Biol. 18: 2884–2891. - PMC - PubMed

Publication types

MeSH terms