

System dynamics modeling for public health: background and opportunities
- PMID: 16449591
- PMCID: PMC1470525
- DOI: 10.2105/AJPH.2005.062059
System dynamics modeling for public health: background and opportunities
Abstract
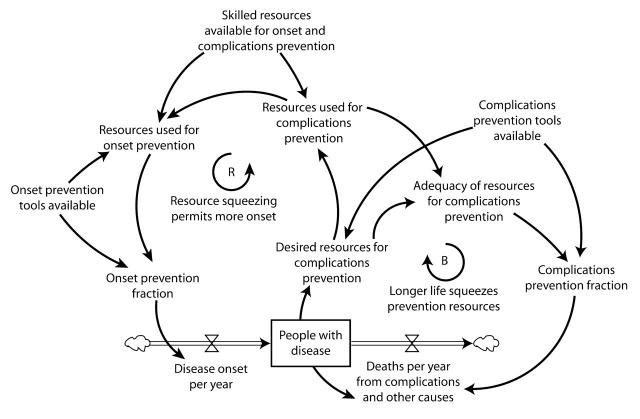
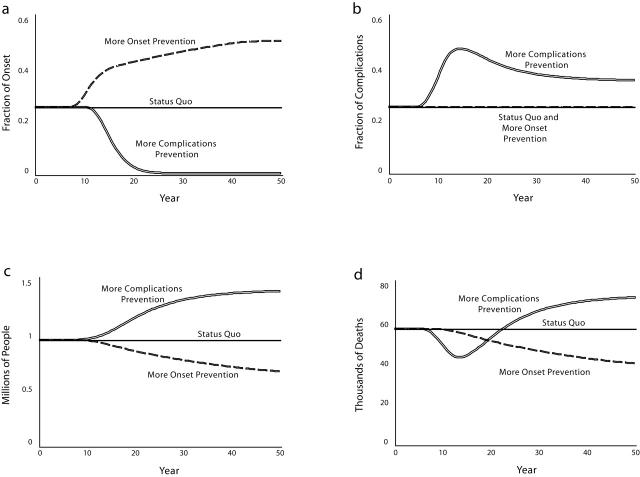
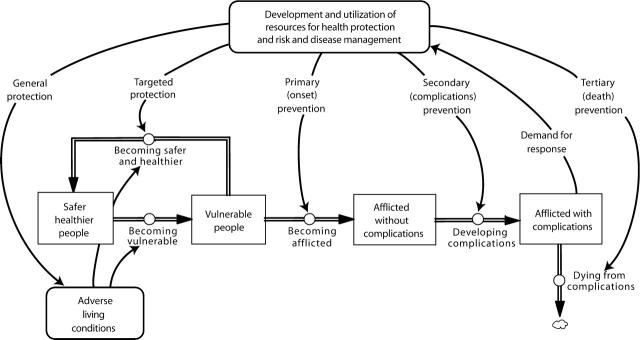
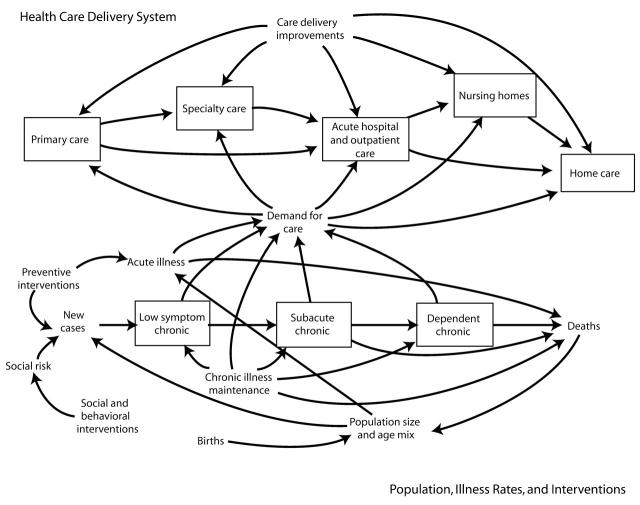
The systems modeling methodology of system dynamics is well suited to address the dynamic complexity that characterizes many public health issues. The system dynamics approach involves the development of computer simulation models that portray processes of accumulation and feedback and that may be tested systematically to find effective policies for overcoming policy resistance. System dynamics modeling of chronic disease prevention should seek to incorporate all the basic elements of a modern ecological approach, including disease outcomes, health and risk behaviors, environmental factors, and health-related resources and delivery systems. System dynamics shows promise as a means of modeling multiple interacting diseases and risks, the interaction of delivery systems and diseased populations, and matters of national and state policy.
Figures
References
-
- Institute of Medicine (Committee on Quality of Health Care in America). Crossing the Quality Chasm: A New Health System for the 21st Century. Washington, DC: National Academies Press; 2001.
-
- Institute of Medicine (Board on Health Sciences Policy). Unequal Treatment: Confronting Racial and Ethnic Disparities in Health Care. Washington, DC: National Academies Press; 2003. - PubMed
-
- Lee P, Paxman D. Reinventing public health. Annu Rev Public Health. 1997;18:1–35. - PubMed
-
- Heirich M. Rethinking Health Care: Innovation and Change in America. Boulder, Colo: Westview Press; 1999.
MeSH terms
LinkOut - more resources
Full Text Sources
