. 2006 Feb;26(4):1496-509.
doi: 10.1128/MCB.26.4.1496-1509.2006.

Evidence that Spt2/Sin1, an HMG-like factor, plays roles in transcription elongation, chromatin structure, and genome stability in Saccharomyces cerevisiae

Affiliations

Evidence that Spt2/Sin1, an HMG-like factor, plays roles in transcription elongation, chromatin structure, and genome stability in Saccharomyces cerevisiae

Amine Nourani et al. Mol Cell Biol. 2006 Feb.

Abstract

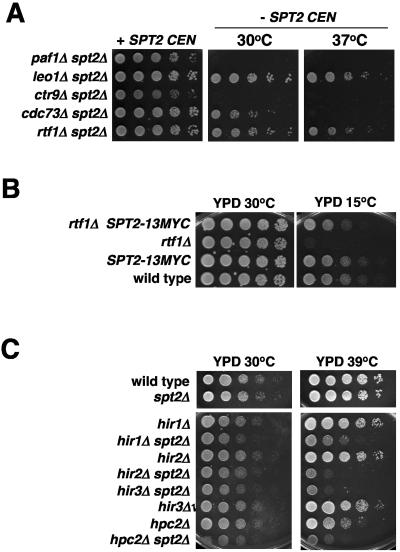
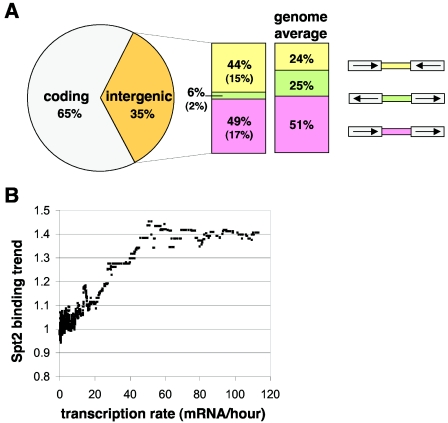
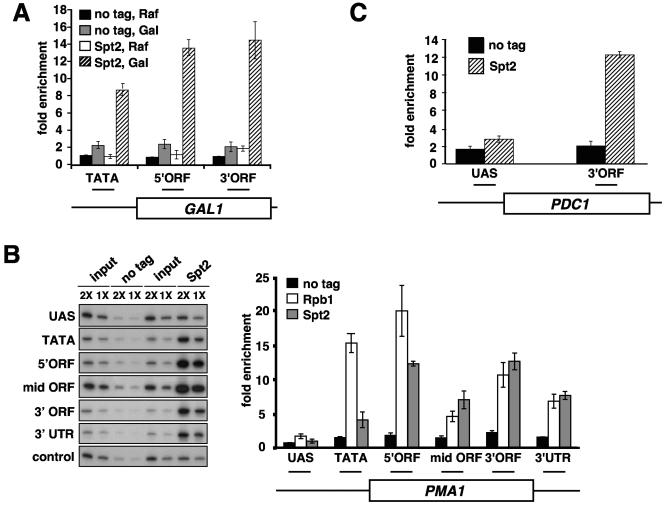
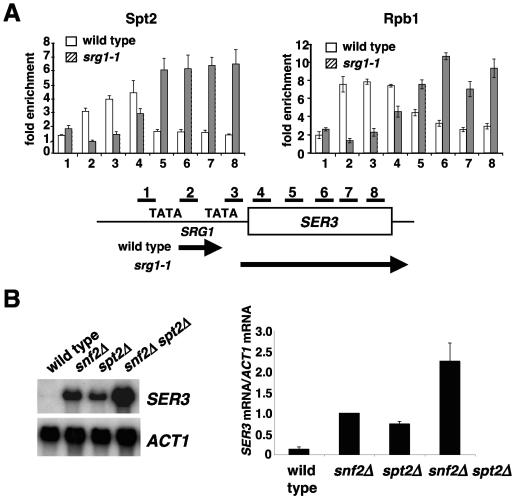
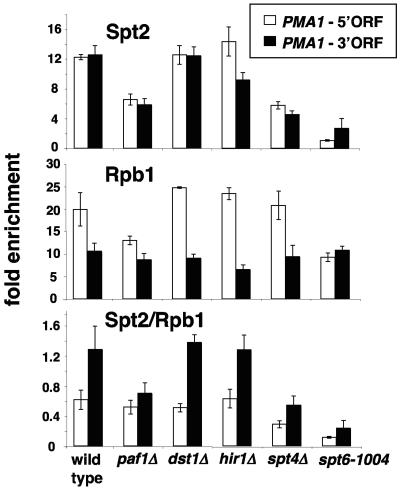
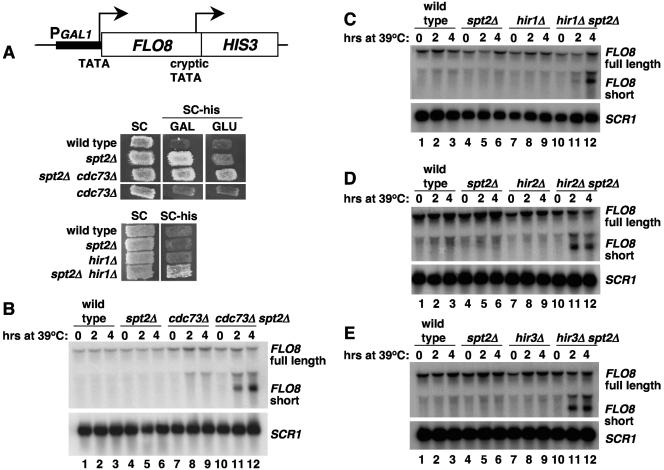
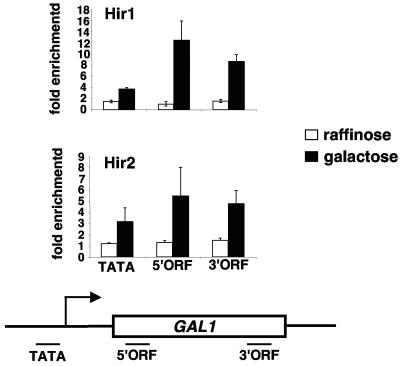
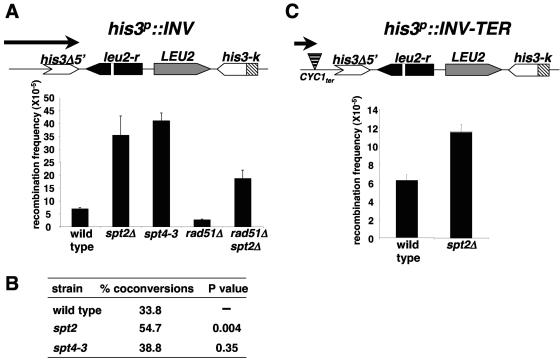
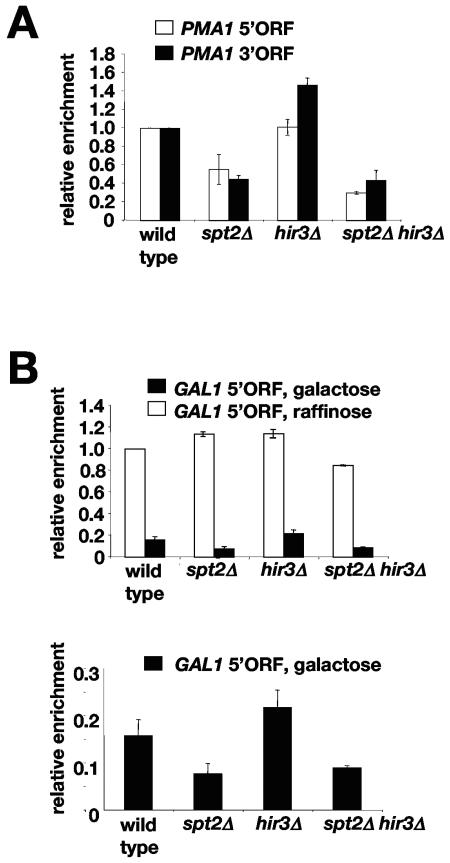
Spt2/Sin1 is a DNA binding protein with HMG-like domains that has been suggested to play a role in chromatin-mediated transcription in Saccharomyces cerevisiae. Previous studies have suggested models in which Spt2 plays an inhibitory role in the initiation of transcription of certain genes. In this work, we have taken several approaches to study Spt2 in greater detail. Our results have identified previously unknown genetic interactions between spt2Delta and mutations in genes encoding transcription elongation factors, including members of the PAF and HIR/HPC complexes. In addition, genome-wide and gene-specific chromatin immunoprecipitation analyses suggest that Spt2 is primarily associated with coding regions in a transcription-dependent fashion. Furthermore, our results show that Spt2, like other elongation factors, is required for the repression of transcription from a cryptic promoter within a coding region and that Spt2 is also required for repression of recombination within transcribed regions. Finally, we provide evidence that Spt2 plays a role in regulating the levels of histone H3 over transcribed regions. Taken together, our results suggest a direct link for Spt2 with transcription elongation, chromatin dynamics, and genome stability.


Figures

FIG. 1.
FIG. 1.
Genetic interactions of spt2Δ. (A) spt2Δ is synthetically lethal with paf1Δ and ctr9Δ. An spt2Δ mutant (FY2432) was transformed with pLL15, a CEN URA3 SPT2 plasmid (25). This strain was then mated with paf1Δ (FY2132), leo1Δ (Research Genetics), ctr9Δ (FY2124), cdc73Δ (FY2127), and rtf1Δ (FY2116) mutants. Diploids were sporulated and dissected, and representative progeny were spotted onto medium lacking uracil (+SPT2 CEN) or medium containing 5FOA (−SPT2 CEN) at 30°C and 37°C. (B) SPT2-13MYC suppresses the cold-sensitive phenotype of rtf1Δ. Serial dilutions of wild-type (FY2442), SPT2-Myc (FY2427), rtf1Δ (FY2116) and rtf1Δ SPT2-13Myc (FY2437) strains were grown in YPD for 2 days at 30°C or 7 days at 15°C. (C) spt2Δ interacts genetically with all the HIR/HPC complex members. Serial dilutions of cell cultures from wild-type (FY2442), spt2Δ (FY2431), hir1Δ (FY1235), hir1Δ spt2Δ (FY2451), hir2Δ (FY2443), hir2Δ spt2Δ (FY2444), hir3Δ spt2Δ (FY2440), hir3Δ (FY2441), hpc2Δ (L1097), and hpc2Δ spt2Δ (L1098) strains were grown on the indicated media for 2 or 3 days at the indicated temperature.
FIG. 2.
FIG. 2.
Spt2 associates predominantly with actively transcribed regions. (A) A pie chart of the distribution of the Spt2-enriched loci (P < 0.005) between coding and intergenic regions. For the 180 loci enriched for Spt2, the most enriched array feature was classified as coding (gray) or noncoding (intergenic; orange). The intergenic features were further subdivided into those containing two terminators (yellow), two promoters (green), or one promoter and one terminator (pink). The distribution of these three classes of intergenic regions across the whole genome is also shown (genome average). (B) Spt2 association correlates with transcription rate genome wide. The Spt2 binding trend is plotted against the transcription rate for all yeast genes. The binding trend was determined as described previously by computing a sliding median of the Spt2 binding ratios across all genes ordered by transcription rate (24, 26, 38, 39, 49, 66). The genome-wide transcription rate was determined previously (14).
FIG. 3.
FIG. 3.
Spt2 is preferentially localized to transcribed regions of active genes. (A) Spt2-13Myc is recruited to the transcribed regions of GAL1 upon galactose induction. Yeast cells from the untagged strain (FY1856) or a strain expressing Spt2-13Myc (FY2427) were grown in YPraf medium. Cells were either formaldehyde fixed or shifted to YPgal medium for 2 hours prior to formaldehyde treatment. Chromatin immunoprecipitations were then performed using the A14 anti-Myc antibody. The horizontal bars in the diagram represent the regions assayed by PCR. The fold enrichment is calculated as the ratio of percent IP of the indicated region to percent IP of a nontranscribed control region. The values shown represent the averages and standard errors from three independent experiments. (B) Spt2 is associated with the transcribed region of PMA1. Yeast cells from an untagged strain (FY1856) or a strain expressing an Spt2-13Myc epitope-tagged protein (FY2427) were grown in YPD and cross-linked with 1% formaldehyde. Chromatin immunoprecipitations were performed using the A14 anti-Myc antibody to immunoprecipitate Spt2-13Myc and the 8WG16 antibody to immunoprecipitate Rpb1. The horizontal bars in the diagram represent the regions assayed by PCR. The fold enrichment is the ratio of percent IP of the indicated region to percent IP of the control region. The values shown represent the averages and standard errors from three independent experiments. UAS, upstream activation sequence. (C) Spt2 is associated with a transcribed region of PDC1. Growth and chromatin immunoprecipitation were performed as described for panel B.
FIG. 4.
FIG. 4.
Association of Spt2 and Rpb1 with SRG1 and SER3. (A) Cells from a wild-type strain (FY2435) and an srg1-1 mutant (FY2434) with a mutation in the SRG1 TATA element (32) were analyzed by chromatin immunoprecipitation for the association of Spt2-13Myc (using A14 anti-Myc antibody) and Rpb1 (using 8WG16 antibody). The fold enrichment is calculated as described for Fig. 3. The values shown represent the averages and standard errors from three independent experiments. (B) An spt2Δ mutation causes derepression of SER3 transcription. Cells from wild-type (FY2428), snf2Δ (FY2429), spt2Δ (FY2431), and snf2Δ spt2Δ (FY2430) strains were grown in YPD, total RNA was extracted, and Northern hybridization analysis was performed for SER3. ACT1 served as a loading control. The relative expression of the SER3 gene in the different mutants is also shown. The ratio of SER3 mRNA to ACT1 mRNA in the snf2Δ strain was arbitrarily set equal to 1.0. The ratios for the other strains were divided by the snf2Δ ratio. The quantification shown represents the averages and standard errors from three independent experiments.
FIG. 5.
FIG. 5.
Recruitment of Spt2 to PMA1 is dependent on Spt6. (A) Spt2 association with PMA1 in different transcription elongation mutants. Chromatin immunoprecipitation of Spt2-13Myc (top panel) and Rpb1 (middle panel) was performed as described for Fig. 3 with wild-type (FY2427), paf1Δ (FY2446), dst1Δ (FY2447), hir1Δ (FY2448), spt4Δ (FY2449), and spt6-1004 (FY2450) strains. Two regions of PMA1 (5′ORF or 3′ORF) were analyzed by PCR. The fold enrichment was calculated as described for Fig. 3. The relative occupancy of Spt2 at PMA1 is shown in the bottom panel. The values represent the averages and standard errors from three independent experiments.
FIG. 6.
FIG. 6.
Spt2, the PAF complex, and the HIR/HPC complex collaborate to inhibit transcription from the FLO8 cryptic promoter. (A) Spt2 contributes to the inhibition of transcription initiation from the cryptic promoter of the pGAL1::FLO8-HIS3 reporter gene. The reporter construct is diagrammed in the top part of the figure. Below are shown patches of wild-type (FY2452), spt2Δ (FY2445), spt2Δ cdc73Δ (FY2453), and cdc73Δ (FY2454) strains containing the pGAL1::FLO8::HIS3 reporter construct that were initially grown on a YPD plate and then replica plated to synthetic complete medium (SC) or medium lacking histidine (SC-his) and containing galactose or glucose as the carbon source. The photograph was taken 2 days after incubation at 30°C. In the lower panel, wild-type (FY2452), spt2Δ (FY2445), hir1Δ (FY2503), and spt2Δ hir1Δ (FY2504) strains were replica plated to synthetic complete medium or medium lacking histidine and containing glucose. The photograph was taken after overnight incubation at 30°C. (B) Spt2 and Cdc73 collaborate to inhibit transcription initiation from the FLO8 cryptic promoter. Wild-type (FY1856), spt2Δ (FY2432), cdc73Δ (FY2127), and cdc73Δ spt2Δ (FY2436) strains were grown in YPD at 30°C and then shifted for the indicated times to 39°C. Total RNA was extracted and analyzed by Northern analysis with a probe for FLO8. SCR1 served as a loading control. The FLO8 probe identifies the full-length FLO8 mRNA and the FLO8 short RNA, which has been previously shown to initiate from a cryptic promoter (18). The band between the full-length and short FLO8 RNAs is believed to be an artifact caused by the presence of rRNA. (C) Spt2 and Hir1 collaborate to inhibit initiation of transcription from the FLO8 cryptic promoter. Cells from wild-type (FY2442), hir1Δ (FY1235), spt2Δ (FY2431), and hir1Δ spt2Δ (FY2451) strains were grown and analyzed as described for panel B. (D) Spt2 and Hir2 collaborate to inhibit initiation of transcription from the FLO8 cryptic promoter. Cells from wild-type (FY2442), hir2Δ (FY2443), spt2Δ (FY2431), and hir2Δ spt2Δ (FY2444) strains were treated as described for panel B. (E) Spt2 and Hir3 collaborate to inhibit initiation of transcription from the FLO8 cryptic promoter. Cells from wild-type (FY2442), hir3Δ (FY2441), spt2Δ (FY2431), and hir3Δ spt2Δ (FY2440) strains were treated as described for panel B.
FIG. 7.
FIG. 7.
The Hir1 and Hir2 proteins are recruited to the transcribed regions of GAL1 upon galactose induction. Yeast cells expressing Hir1-13Myc (FY2438) or Hir2-13Myc (FY2439) were grown in YPraf medium. Cells were either formaldehyde fixed or shifted to 2% YPgal medium for 2 hours prior to the formaldehyde treatment. Chromatin was extracted and subjected to immunoprecipitation using the anti-Myc antibody. The fold enrichment is calculated as described for Fig. 3. The values shown represent the averages and standard errors from three independent experiments.
FIG. 8.
FIG. 8.
An spt2Δ mutation increases recombination between inverted repeats. (A) Measurement of recombination using the hi3p::INV inverted repeat system (1). The structure of the inverted repeats is diagrammed at the top. In each experiment, six separate colonies from wild-type (M137-11B), spt2Δ (L1096), spt4-3 (M236-12D), rad51Δ (L1099), and rad51Δ spt2Δ (L1100) strains were independently grown to saturation in YPD and plated on either synthetic complete medium or medium lacking histidine. The frequency of recombination for each independent culture is equal to the frequency of His+ colonies. The recombination frequencies shown are the averages and standard errors from three experiments. (B) spt2Δ increases coconversion events. The percentage of coconversion was determined by calculating the ratio of His+ Leu colonies to His+ Leu+ colonies. In each experiment, six separate colonies were tested, and the values shown are the averages and standard errors from three experiments. (C) Reducing transcription through the his3p::INV inverted repeats decreases spt2Δ hyperrecombination. The recombination frequency was calculated for wild-type (ITE-1C) or spt2Δ (L1101) strains containing the his3p::INV TER (diagrammed at the top). This construct has a CYC1 terminator inserted before the his3-5′Δ sequence, reducing transcription through the inverted repeat cassette (30). The recombination frequencies were calculated as described for panel A.
FIG. 9.
FIG. 9.
Spt2 is required for a normal level of histone H3 over the PMA1 and GAL1 transcribed regions. (A) An spt2Δ mutation reduces histone H3 association at PMA1. Cells from wild-type (FY2442), spt2Δ (FY2431), hir3Δ (FY2441), and hir3Δ spt2Δ (FY2440) strains were grown in YPD at 30°C and shifted to 39°C for 4 hours. Chromatin immunoprecipitations were performed using an anti-histone H3 antibody. For each strain, the fold enrichment shown is relative to the fold enrichment calculated for the wild-type strain arbitrarily set at 1.0. The values shown are the averages and standard errors from three independent experiments. (B) An spt2Δ mutation affects histone H3 levels at the GAL1 5′ ORF upon galactose induction. The relative values shown were calculated as described for panel A. The reference value in this case is the fold enrichment for the wild-type strain grown in 2% raffinose. The bottom panel shows only the relative values after a shift to 2% galactose and heat shock treatment for 2 h at 39°C. All values shown are the averages and standard errors from three independent experiments. The P values for these experiments are <0.03.

Similar articles

Cited by

References

    1. Aguilera, A., and H. L. Klein. 1989. Genetic and molecular analysis of recombination events in Saccharomyces cerevisiae occurring in the presence of the hyper-recombination mutation hpr1. Genetics 122:503-517. - PMC - PubMed
    1. Ausubel, F. M., R. Brent, R. E. Kingston, D. D. Moore, J. G. Seidman, J. A. Smith, and K. Struhl. 1991. Current protocols in molecular biology. Wiley-Interscience, New York, N.Y.
    1. Baudin, A., O. Ozier-Kalogeropoulos, A. Denouel, F. Lacroute, and C. Cullin. 1993. A simple and efficient method for direct gene deletion in Saccharomyces cerevisiae. Nucleic Acids Res. 21:3329-3330. - PMC - PubMed
    1. Baxter, B. K., and E. A. Craig. 1998. Suppression of an Hsp70 mutant phenotype in Saccharomyces cerevisiae through loss of function of the chromatin component Sin1p/Spt2p. J. Bacteriol. 180:6484-6492. - PMC - PubMed
    1. Betz, J. L., M. Chang, T. M. Washburn, S. E. Porter, C. L. Mueller, and J. A. Jaehning. 2002. Phenotypic analysis of Paf1/RNA polymerase II complex mutations reveals connections to cell cycle regulation, protein synthesis, and lipid and nucleic acid metabolism. Mol. Genet. Genomics 268:272-285. - PubMed

Publication types

MeSH terms