

Transcriptional profiling of Epstein-Barr virus (EBV) genes and host cellular genes in nasal NK/T-cell lymphoma and chronic active EBV infection
- PMID: 16449999
- PMCID: PMC2361178
- DOI: 10.1038/sj.bjc.6602968
Transcriptional profiling of Epstein-Barr virus (EBV) genes and host cellular genes in nasal NK/T-cell lymphoma and chronic active EBV infection
Abstract
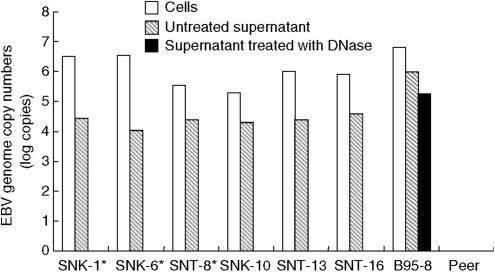
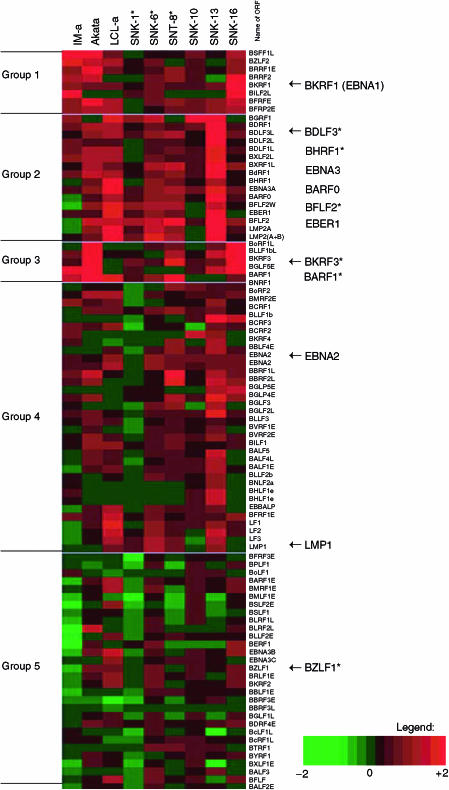
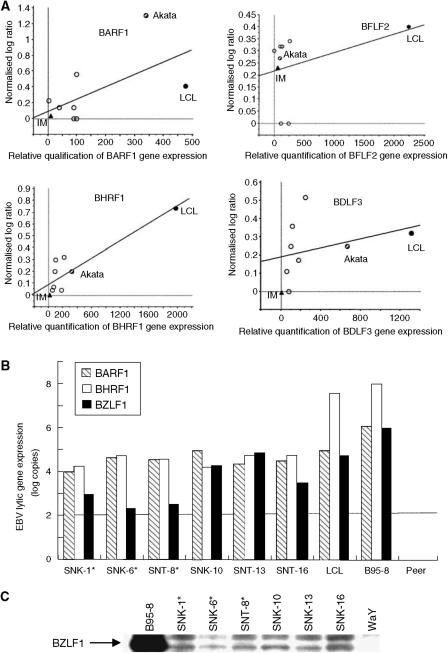
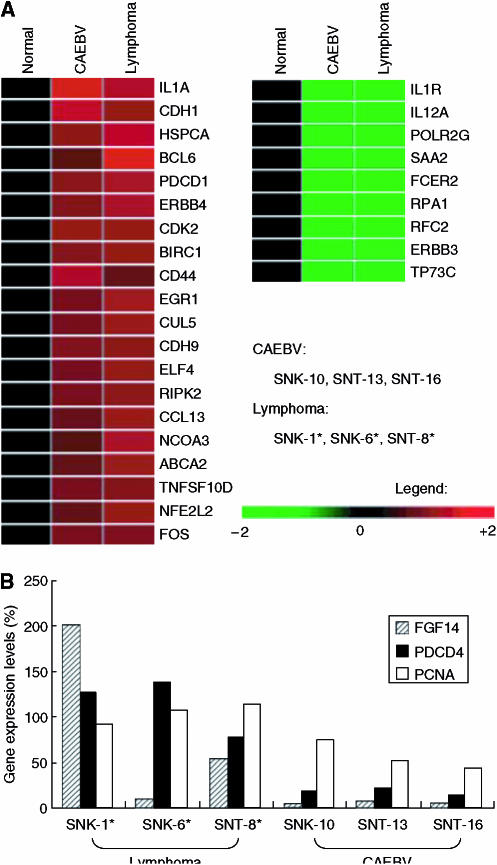
Nasal NK/T-cell lymphoma is an aggressive subtype of non-Hodgkin lymphoma (NHL) that is closely associated with Epstein-Barr virus (EBV). The clonal expansion of EBV-infected NK or T cells is also seen in patients with chronic active EBV (CAEBV) infection, suggesting that two diseases might share a partially similar mechanism by which EBV affects host cellular gene expression. To understand the pathogenesis of EBV-associated NK/T-cell lymphoproliferative disorders (LPD) and design new therapies, we employed a novel EBV DNA microarray to compare patterns of EBV expression in six cell lines established from EBV-associated NK/T-cell LPD. We found that expression of BZLF1, which encodes the immediate-early gene product Zta, was expressed in SNK/T cells and the expression levels were preferentially high in cell lines from CAEBV infection. We also analyzed the gene expression patterns of host cellular genes using a human oligonucleotide DNA microarray. We identified a subset of pathogenically and clinically relevant host cellular genes, including TNFRSF10D, CDK2, HSPCA, IL12A as a common molecular biological properties of EBV-associated NK/T-cell LPD and a subset of genes, such as PDCD4 as a putative contributor for disease progression. This study describes a novel approach from the aspects of viral and host gene expression, which could identify novel therapeutic targets in EBV-associated NK/T-cell LPD.
Figures
Similar articles
-
Expression of interleukin-9 in nasal natural killer/T-cell lymphoma cell lines and patients.Clin Cancer Res. 2005 Dec 1;11(23):8250-7. doi: 10.1158/1078-0432.CCR-05-1426. Clin Cancer Res. 2005. PMID: 16322282
-
Nasal natural killer/T-cell lymphoma and its association with type "i"/XhoI loss strain Epstein-Barr virus in Chile.J Clin Pathol. 2007 Jun;60(6):656-60. doi: 10.1136/jcp.2005.034199. Epub 2006 Jun 14. J Clin Pathol. 2007. PMID: 16775124 Free PMC article.
-
Clinicopathological states of Epstein-Barr virus-associated T/NK-cell lymphoproliferative disorders (severe chronic active EBV infection) of children and young adults.Int J Oncol. 2004 May;24(5):1165-74. Int J Oncol. 2004. PMID: 15067338
-
Epstein-Barr virus-associated T/natural killer-cell lymphoproliferative disorders.J Dermatol. 2014 Jan;41(1):29-39. doi: 10.1111/1346-8138.12322. J Dermatol. 2014. PMID: 24438142 Review.
-
Proposed categorization of pathological states of EBV-associated T/natural killer-cell lymphoproliferative disorder (LPD) in children and young adults: overlap with chronic active EBV infection and infantile fulminant EBV T-LPD.Pathol Int. 2008 Apr;58(4):209-17. doi: 10.1111/j.1440-1827.2008.02213.x. Pathol Int. 2008. PMID: 18324913 Review.
Cited by
-
Gene expression profiling identifies emerging oncogenic pathways operating in extranodal NK/T-cell lymphoma, nasal type.Blood. 2010 Feb 11;115(6):1226-37. doi: 10.1182/blood-2009-05-221275. Epub 2009 Nov 30. Blood. 2010. PMID: 19965620 Free PMC article.
-
The Role and Interactions of Programmed Cell Death 4 and its Regulation by microRNA in Transformed Cells of the Gastrointestinal Tract.Front Oncol. 2022 Jun 29;12:903374. doi: 10.3389/fonc.2022.903374. eCollection 2022. Front Oncol. 2022. PMID: 35847932 Free PMC article. Review.
-
Quantitative and qualitative RNA-Seq-based evaluation of Epstein-Barr virus transcription in type I latency Burkitt's lymphoma cells.J Virol. 2010 Dec;84(24):13053-8. doi: 10.1128/JVI.01521-10. Epub 2010 Oct 13. J Virol. 2010. PMID: 20943983 Free PMC article.
-
The Epstein-Barr Virus Enhancer Interaction Landscapes in Virus-Associated Cancer Cell Lines.J Virol. 2022 Sep 28;96(18):e0073922. doi: 10.1128/jvi.00739-22. Epub 2022 Sep 12. J Virol. 2022. PMID: 36094314 Free PMC article.
-
Role of Epstein-Barr Virus and Human Papillomavirus Coinfection in Cervical Cancer: Epidemiology, Mechanisms and Perspectives.Pathogens. 2020 Aug 21;9(9):685. doi: 10.3390/pathogens9090685. Pathogens. 2020. PMID: 32839399 Free PMC article. Review.
References
-
- Aritaki K, Ohyashiki JH, Suzuki A, Ojima T, Abe K, Shimizu N, Yamamoto K, Ohyashiki K, Hoshika A (2001) A rapid monitoring system of human herpesviruses reactivation by LightCycler in stem cell transplantation. Bone Marrow Transplant 28: 975–980 - PubMed
-
- Bauer CC, Aberle SW, Popow-Kraupp T, Kapitan M, Hofmann H, Puchhammer-Stockl E (2005) Serum Epstein–Barr virus DNA load in primary Epstein–Barr virus infection. J Med Virol 75: 54–58 - PubMed
-
- Cohen JI (2000) Epstein–Barr virus infection. N Engl J Med 343: 481–492 - PubMed
-
- Decaussin G, Sbih-Lammali F, de Turenne-Tessier M, Bouguermouh A, Ooka T (2000) Expression of BARF1 gene encoded by Epstein–Barr virus in nasopharyngeal carcinoma biopsies. Cancer Res 60: 5584–5588 - PubMed
-
- Gallagher A, Armstrong AA, MacKenzie J, Shield L, Khan G, Lake A, Proctor S, and Taylor P, Clements GB, Jarrett RF (1999) Detection of Epstein–Barr virus (EBV) genomes in the serum of patients with EBV-associated Hodgkin's disease. Int J Cancer 84: 442–448 - PubMed
Publication types
MeSH terms
LinkOut - more resources
Full Text Sources
Medical
Molecular Biology Databases
Miscellaneous
