

Comparative Study
doi: 10.1186/1471-2156-6-S1-S11.
Comparison of marker types and map assumptions using Markov chain Monte Carlo-based linkage analysis of COGA data
Affiliations
- PMID: 16451566
- PMCID: PMC1866829
- DOI: 10.1186/1471-2156-6-S1-S11
Item in Clipboard
Comparative Study
Comparison of marker types and map assumptions using Markov chain Monte Carlo-based linkage analysis of COGA data
BMC Genet.
.
Abstract
We performed multipoint linkage analysis of the electrophysiological trait ECB21 on chromosome 4 in the full pedigrees provided by the Collaborative Study on the Genetics of Alcoholism (COGA). Three Markov chain Monte Carlo (MCMC)-based approaches were applied to the provided and re-estimated genetic maps and to five different marker panels consisting of microsatellite (STRP) and/or SNP markers at various densities. We found evidence of linkage near the GABRB1 STRP using all methods, maps, and marker panels. Difficulties encountered with SNP panels included convergence problems and demanding computations.
Figures
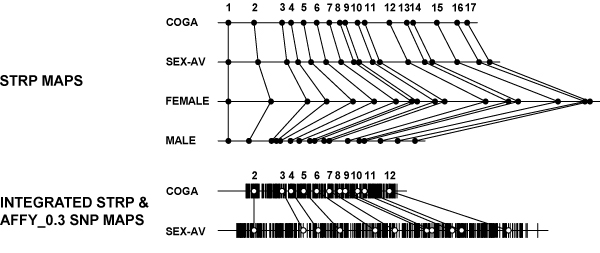
Genetic maps of chromosome 4. Genetic distances for the 17 chromosome 4 STRPs (●) on the COGA map or the re-estimated sex-averaged, female, and male maps. Integrated maps for the STRPs (○) and AFFY_0.3 SNPs (|) based on interpolation of SNPs onto the COGA map or map estimation from the data.
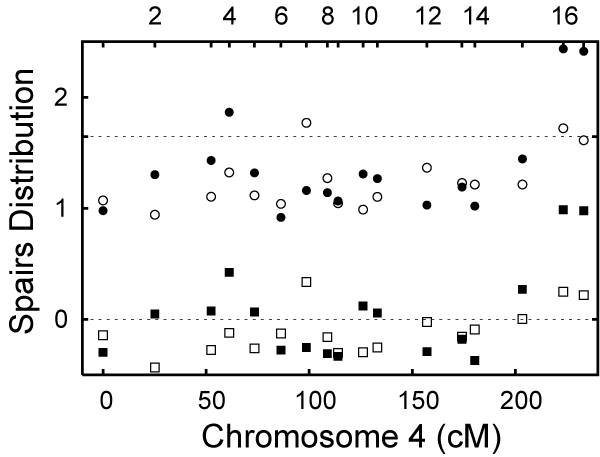
Simulated unlinked trait. Spairs distribution for 1,000 datasets with a simulated unlinked trait and the real STRP data (solid symbols) and 1,000 true null datasets (open symbols). The 50th (squares) and 95th (circles) percentiles of the Spairs distributions at each STRP are shown. Numbers and tick markers on the top axis denote STRPs and their positions. Dotted lines indicate the 50th and 95th percentiles assuming a normally distributed score.
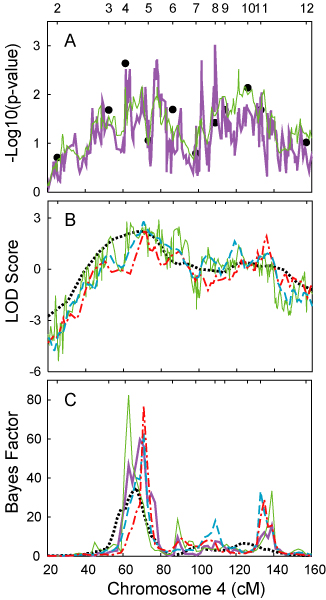
Linkage analyses of ECB21 on chromosome 4. Linkage results for three MCMC approaches (A-C) and 5 marker panels: STRPs only (black dots in A or dotted line in B-C), AFFY_0.3 (thick purple line), STRPs plus AFFY_0.3 (thin green line), ILMN_1.5 (red dashes and dots), and AFFY_1.5 (blue dashes). (A) Negative log10 of the p-values for Spairs for ECB21_D. (B) LOD scores for ECB21_Q. (C) Bayes factors for ECB21_Q. Numbers and tick markers on the top axis denote STRPs and their positions.
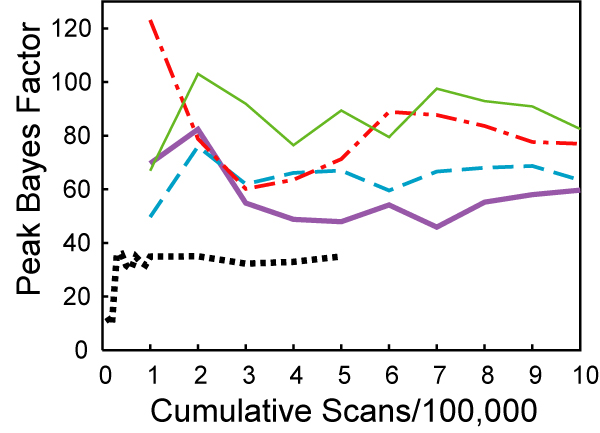
Convergence of Bayes factor. Analyses of ECB21_Q on chromosome 4 using 17 STRPs (black dotted line), 476 AFFY_0.3 SNPs (thick purple line), 487 combined STRPs and AFFY_0.3 SNPs (thin green line), 140 ILMN_1.5 SNPs (red dashes and dots), and 97 AFFY_1.5 SNPs (blue dashes). Bayes factors for the final chromosome position of the strongest peak were estimated at intermediate points during the run.
References
-
- Porjesz B, Almasy L, Edenberg HJ, Wang K, Chorlian DB, Foroud T, Goate A, Rice JP, O'Connor SJ, Rohrbaugh J, Kuperman S, Bauer LO, Crowe RR, Schuckit MA, Hesselbrock V, Conneally PM, Tischfield JA, Li TK, Reich T, Begleiter H. Linkage disequilibrium between the beta frequency of the human EEG and a GABAA receptor gene locus. Proc Natl Acad Sci USA. 2002;99:3729–3733. doi: 10.1073/pnas.052716399. - DOI - PMC - PubMed
-
- Pedigree Analysis for Genetics http://www.stat.washington.edu/thompson/Genepi/pangaea.shtml
Publication types
MeSH terms
Grants and funding
LinkOut - more resources
Full Text Sources
Medical
