

Evaluation of linkage disequilibrium and its effect on non-parametric multipoint linkage analysis using two high density single-nucleotide polymorphism mapping panels
- PMID: 16451700
- PMCID: PMC1866695
- DOI: 10.1186/1471-2156-6-S1-S85
Evaluation of linkage disequilibrium and its effect on non-parametric multipoint linkage analysis using two high density single-nucleotide polymorphism mapping panels
Abstract
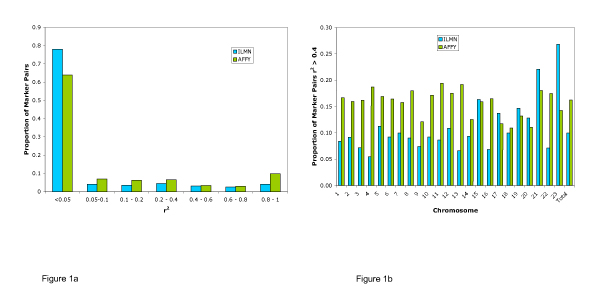
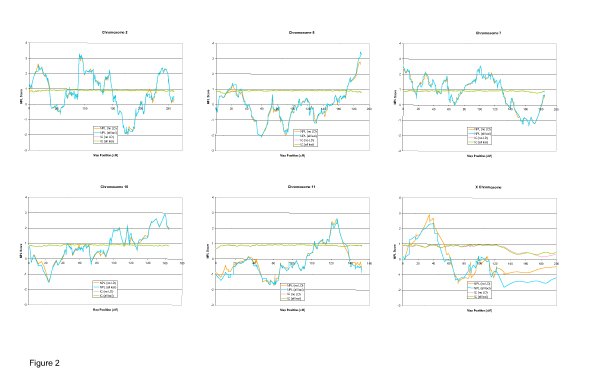
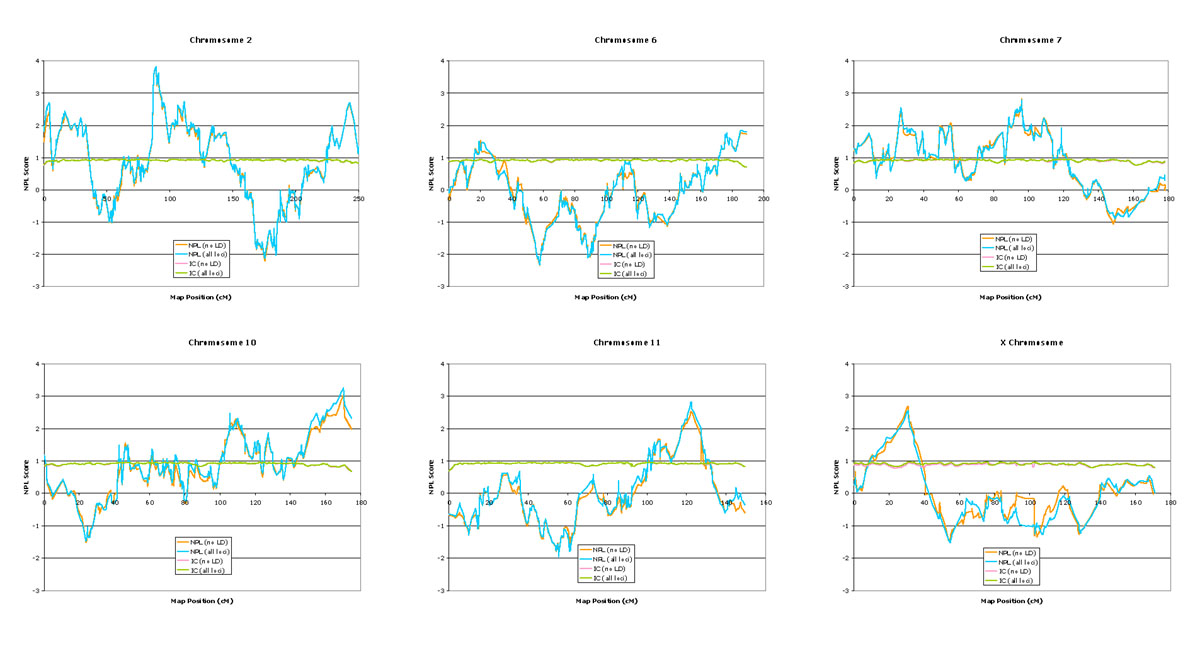
Genotype data from the Illumina Linkage III SNP panel (n = 4,720 SNPs) and the Affymetrix 10 k mapping array (n = 11,120 SNPs) were used to test the effects of linkage disequilibrium (LD) between SNPs in a linkage analysis in the Collaborative Study on the Genetics of Alcoholism pedigree collection (143 pedigrees; 1,614 individuals). The average r2 between adjacent markers across the genetic map was 0.099 +/- 0.003 in the Illumina III panel and 0.17 +/- 0.003 in the Affymetrix 10 k array. In order to determine the effect of LD between marker loci in a nonparametric multipoint linkage analysis, markers in strong LD with another marker (r2 > 0.40) were removed (n = 471 loci in the Illumina panel; n = 1,804 loci in the Affymetrix panel) and the linkage analysis results were compared to the results using the entire marker sets. In all analyses using the ALDX1 phenotype, 8 linkage regions on 5 chromosomes (2, 7, 10, 11, X) were detected (peak markers p < 0.01), and the Illumina panel detected an additional region on chromosome 6. Analysis of the same pedigree set and ALDX1 phenotype using short tandem repeat markers (STRs) resulted in 3 linkage regions on 3 chromosomes (peak markers p < 0.01). These results suggest that in this pedigree set, LD between loci with spacing similar to the SNP panels tested may not significantly affect the overall detection of linkage regions in a genome scan. Moreover, since the data quality and information content are greatly improved in the SNP panels over STR genotyping methods, new linkage regions may be identified due to higher information content and data quality in a dense SNP linkage panel.
Figures
Similar articles
-
Assessment and implications of linkage disequilibrium in genome-wide single-nucleotide polymorphism and microsatellite panels.Genet Epidemiol. 2005;29 Suppl 1:S72-6. doi: 10.1002/gepi.20112. Genet Epidemiol. 2005. PMID: 16342185
-
Linkage mapping methods applied to the COGA data set: presentation Group 4 of Genetic Analysis Workshop 14.Genet Epidemiol. 2005;29 Suppl 1:S29-34. doi: 10.1002/gepi.20107. Genet Epidemiol. 2005. PMID: 16342182
-
A genome-wide linkage analysis of alcoholism on microsatellite and single-nucleotide polymorphism data, using alcohol dependence phenotypes and electroencephalogram measures.BMC Genet. 2005 Dec 30;6 Suppl 1(Suppl 1):S17. doi: 10.1186/1471-2156-6-S1-S17. BMC Genet. 2005. PMID: 16451625 Free PMC article.
-
Multipoint linkage disequilibrium mapping approach: incorporating evidence of linkage and linkage disequilibrium from unlinked region.Genet Epidemiol. 2003 Jul;25(1):1-13. doi: 10.1002/gepi.10241. Genet Epidemiol. 2003. PMID: 12813722 Review.
-
High-density genotyping and linkage disequilibrium in the human genome using chromosome 22 as a model.Curr Opin Chem Biol. 2002 Feb;6(1):24-30. doi: 10.1016/s1367-5931(01)00285-x. Curr Opin Chem Biol. 2002. PMID: 11827819 Review.
Cited by
-
Genome-wide linkage scan reveals three putative breast-cancer-susceptibility loci.Am J Hum Genet. 2009 Feb;84(2):115-22. doi: 10.1016/j.ajhg.2008.12.013. Epub 2009 Jan 15. Am J Hum Genet. 2009. PMID: 19147119 Free PMC article.
-
Multilocus Sequence Typing of Leuconostoc mesenteroides Strains From the Qinghai-Tibet Plateau.Front Microbiol. 2021 Jan 25;12:614286. doi: 10.3389/fmicb.2021.614286. eCollection 2021. Front Microbiol. 2021. PMID: 33584616 Free PMC article.
-
Linkage analysis with dense SNP maps in isolated populations.Hum Hered. 2009;68(2):87-97. doi: 10.1159/000212501. Epub 2009 Apr 9. Hum Hered. 2009. PMID: 19365135 Free PMC article.
References
-
- Murray JC, Buetow KH, Weber JL, Ludwigsen S, Scherpbierheddema T, Manion F, Quillen J, Sheffield VC, Sunden S, Duyk GM, Weissenbach J, Gyapay G, Dib C, Morrissette J, Lathrop GM, Vignal A, White R, Matsunami N, Gerken S, Melis R, Albertsen H, Plaetke R, Odelberg S, Ward D, Dausset J, Cohen D, Cann H. A comprehensive human linkage map with centimorgan density. Cooperative Human Linkage Center (CHLC) Science. 1994;265:2049–2054. doi: 10.1126/science.8091227. - DOI - PubMed
-
- Kong A, Gudbjartsson DF, Sainz J, Jonsdottir GM, Gudjonsson SA, Richardsson B, Sigurdardottir S, Barnard J, Hallbeck B, Masson G, Shlien A, Palsson ST, Frigge ML, Thorgeirsson TE, Gulcher JR, Stefansson K. A high-resolution recombination map of the human genome. Nat Genet. 2002;31:241–247. - PubMed
MeSH terms
Substances
LinkOut - more resources
Full Text Sources
Other Literature Sources
Research Materials
