

Mortality from ischemic heart disease and diabetes mellitus (type 2) in four U.S. wheat-producing states: a hypothesis-generating study
- PMID: 16451853
- PMCID: PMC1367830
- DOI: 10.1289/ehp.8352
Mortality from ischemic heart disease and diabetes mellitus (type 2) in four U.S. wheat-producing states: a hypothesis-generating study
Abstract
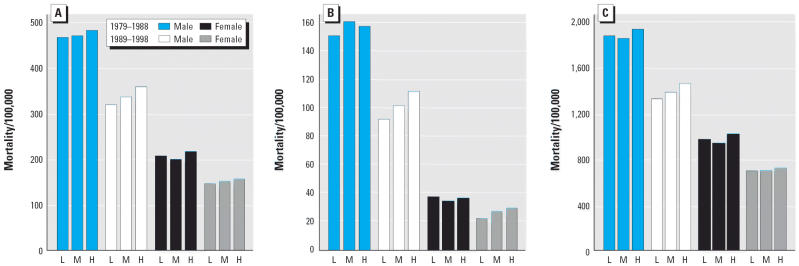
In this ecologic study I examined ischemic heart disease (IHD) and diabetes mortality in rural agricultural counties of Minnesota, Montana, North Dakota, and South Dakota, in association with environmental exposure to chlorophenoxy herbicides, using wheat acreage as a surrogate exposure. I collected data on agricultural land use and 1979-1998 mortality from the U.S. Department of Agriculture and the Centers for Disease Control and Prevention websites, respectively. Counties were grouped based on percentage of land area dedicated to wheat farming. Poisson relative risks (RR) and 95% confidence intervals (CIs), comparing high- and medium- with low-wheat counties, were obtained for IHD, the subcategories acute myocardial infarction (AMI) and coronary atherosclerosis (CAS), and diabetes, adjusting for sex, age, mortality cohort, and poverty index. Mortality from IHD was modestly increased (RR = 1.08; 95% CI, 1.04-1.12). Analyses of its two major forms were more revealing. Compared with low-wheat counties, mortality in high-wheat counties from AMI increased (RR = 1.20; 95% CI, 1.14-1.26), and mortality from CAS decreased (RR = 0.89; 95% CI, 0.83-0.96). Mortality from AMI was more pronounced for those < 65 years of age (RR = 1.31; 95% CI 1.22-1.39). Mortality from type 2 diabetes increased (RR = 1.16; 95% CI, 1.08-1.24). These results suggest that the underlying cause of mortality from AMI and type 2 diabetes increased and the underlying cause of mortality from CAS decreased in counties where a large proportion of the land area is dedicated to spring and durum wheat farming. Firm conclusions on causal inference cannot be reached until more definitive studies have been conducted.
Figures
Similar articles
-
Perturbation of lipids and glucose metabolism associated with previous 2,4-D exposure: a cross-sectional study of NHANES III data, 1988-1994.Environ Health. 2010 Feb 26;9:11. doi: 10.1186/1476-069X-9-11. Environ Health. 2010. PMID: 20187939 Free PMC article.
-
Birth malformations and other adverse perinatal outcomes in four U.S. Wheat-producing states.Environ Health Perspect. 2003 Jul;111(9):1259-64. doi: 10.1289/ehp.5830. Environ Health Perspect. 2003. PMID: 12842783 Free PMC article.
-
Cancer mortality in four northern wheat-producing states.Environ Health Perspect. 2000 Sep;108(9):873-81. doi: 10.1289/ehp.00108873. Environ Health Perspect. 2000. PMID: 11017893 Free PMC article.
-
Geographically based investigation of prostate cancer mortality in four U.S. Northern Plain states.Am J Prev Med. 2006 Feb;30(2 Suppl):S101-8. doi: 10.1016/j.amepre.2005.09.005. Am J Prev Med. 2006. PMID: 16458784
-
Impact of the United States Department of Agriculture, Agricultural Research Service on Plant Pathology: 2015-2020.Phytopathology. 2021 Aug;111(8):1265-1276. doi: 10.1094/PHYTO-09-20-0393-IA. Epub 2021 Sep 22. Phytopathology. 2021. PMID: 33507089 Review.
Cited by
-
A multilevel model for comorbid outcomes: obesity and diabetes in the US.Int J Environ Res Public Health. 2010 Feb;7(2):333-52. doi: 10.3390/ijerph7020333. Epub 2010 Jan 27. Int J Environ Res Public Health. 2010. PMID: 20616977 Free PMC article.
-
Diabetes: time to look beyond gluttony and laziness.Indian J Community Med. 2011 Oct;36(4):253-8. doi: 10.4103/0970-0218.91325. Indian J Community Med. 2011. PMID: 22279253 Free PMC article. No abstract available.
-
Increased risk of atherosclerosis associated with pesticide exposure in rural areas in Korea.PLoS One. 2020 May 1;15(5):e0232531. doi: 10.1371/journal.pone.0232531. eCollection 2020. PLoS One. 2020. PMID: 32357160 Free PMC article.
-
Effects of Environmental Pollutants on Cellular Iron Homeostasis and Ultimate Links to Human Disease.Environ Health Insights. 2016 Mar 7;10:35-43. doi: 10.4137/EHI.S36225. eCollection 2016. Environ Health Insights. 2016. PMID: 26966372 Free PMC article.
-
Perturbation of lipids and glucose metabolism associated with previous 2,4-D exposure: a cross-sectional study of NHANES III data, 1988-1994.Environ Health. 2010 Feb 26;9:11. doi: 10.1186/1476-069X-9-11. Environ Health. 2010. PMID: 20187939 Free PMC article.
References
-
- Aronow WS. C-reactive protein: should it be considered a coronary risk factor? Geriatrics. 2003;58:19–25. - PubMed
-
- Axelson O, Persson B, Wingren G. Dioxin and diabetes mellitus. Epidemiology. 1998;9:358–359. - PubMed
-
- Axelson O, Steenland K. Indirect methods of assessing the effects of tobacco use in occupational studies. Am J Ind Med. 1988;13:105–118. - PubMed
-
- Axelson O, Tagesson C, Hardell L. The clofibrate problem: a different viewpoint. Lancet. 1980 Nov 15;ii:1081–1082. - PubMed
-
- Bertazzi PA, Consonni D, Bachetti S, Rubagotti M, Baccarelli A, Zocchetti C, et al. Health effects of dioxin exposure: a 20-year mortality study. Am J Epidemiol. 2001;153:1031–1044. - PubMed
MeSH terms
Substances
LinkOut - more resources
Full Text Sources
Medical
