Comparative Study
. 2006 Apr;172(4):2405-19.
doi: 10.1534/genetics.105.048330. Epub 2006 Feb 1.

A linkage map for brown trout (Salmo trutta): chromosome homeologies and comparative genome organization with other salmonid fish

Affiliations
Comparative Study

A linkage map for brown trout (Salmo trutta): chromosome homeologies and comparative genome organization with other salmonid fish

Karim Gharbi et al. Genetics. 2006 Apr.

Abstract

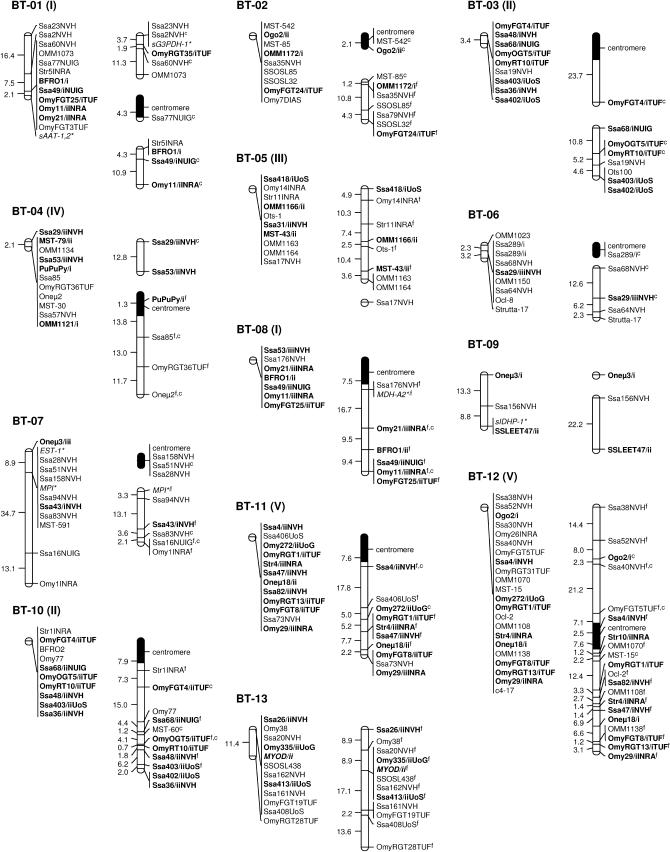
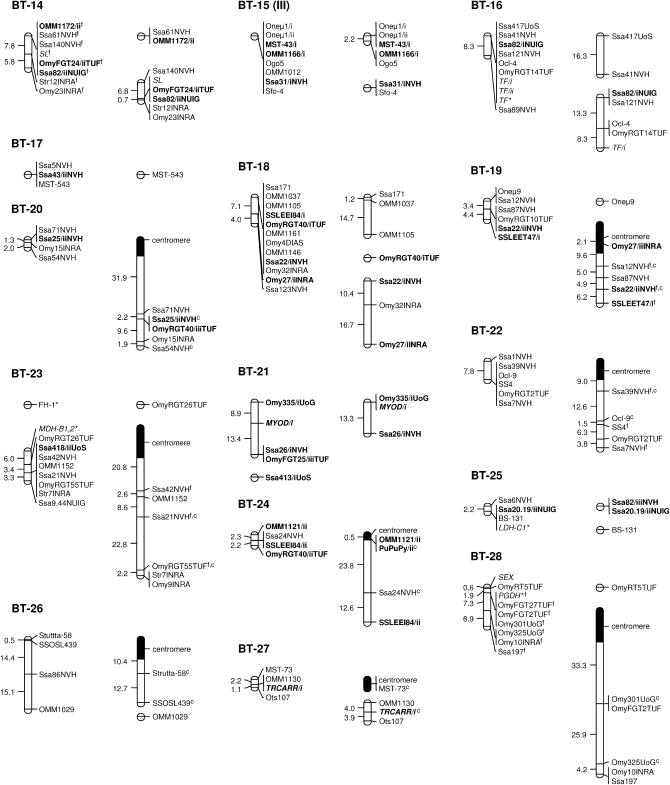
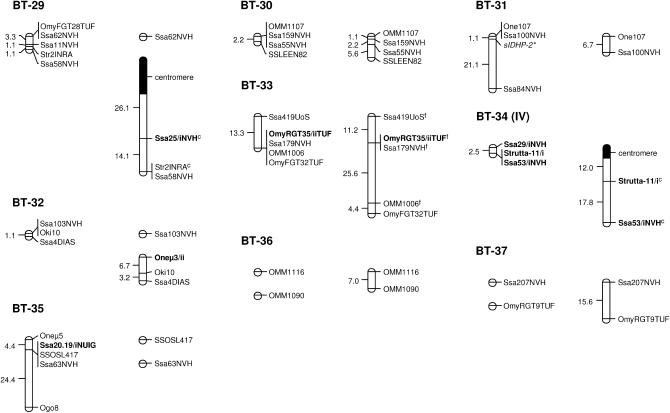
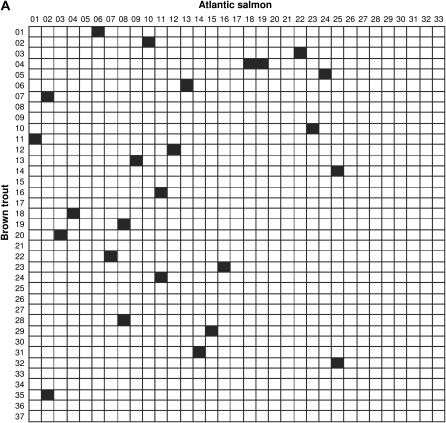
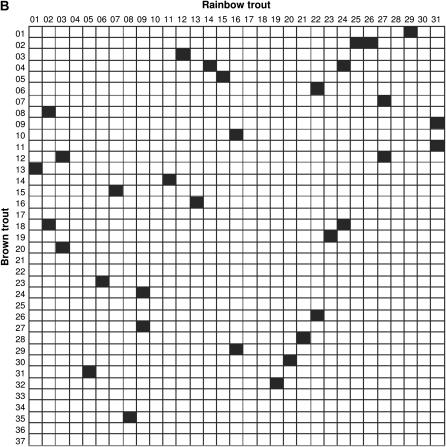
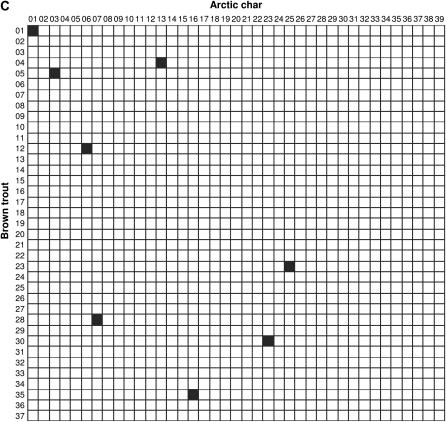
We report on the construction of a linkage map for brown trout (Salmo trutta) and its comparison with those of other tetraploid-derivative fish in the family Salmonidae, including Atlantic salmon (Salmo salar), rainbow trout (Oncorhynchus mykiss), and Arctic char (Salvelinus alpinus). Overall, we identified 37 linkage groups (2n = 80) from the analysis of 288 microsatellite polymorphisms, 13 allozyme markers, and phenotypic sex in four backcross families. Additionally, we used gene-centromere analysis to approximate the position of the centromere for 20 linkage groups and thus relate linkage arrangements to the physical morphology of chromosomes. Sex-specific maps derived from multiple parents were estimated to cover 346.4 and 912.5 cM of the male and female genomes, respectively. As previously observed in other salmonids, recombination rates showed large sex differences (average female-to-male ratio was 6.4), with male crossovers generally localized toward the distal end of linkage groups. Putative homeologous regions inherited from the salmonid tetraploid ancestor were identified for 10 pairs of linkage groups, including five chromosomes showing evidence of residual tetrasomy (pseudolinkage). Map alignments with orthologous regions in Atlantic salmon, rainbow trout, and Arctic char also revealed extensive conservation of syntenic blocks across species, which was generally consistent with chromosome divergence through Robertsonian translocations.


Figures

Figure 1.
Figure 1.
Sex-specific linkage maps of the brown trout genome. Each linkage group (numbered BT-01–BT-37) is represented by a male (left) and a female (right) map derived from the joint analysis of segregation data from families 12, 14, 15, and 17. Roman letters (I–V) in parentheses with linkage group numbers designate pseudolinkage groups. Map distances are indicated in centimorgans to the left of each marker interval (markers within nonrecombinant intervals are shown along the same vertical line). Italicized marker names indicate gene markers, including type I microsatellites and allozymes (shown with an asterisk). A superscript “f” indicates framework markers ordered with high confidence (LOD threshold = 3.0). Markers with multiple copies (denoted as “/i,” “/ii,” and “/iii”) across linkage groups (excluding putative tandem duplications) are shown in boldface type. Markers used for the orientation of linkage groups with respect to the centromere are indicated with a superscript “c” and the position of centromeres is represented by 95% confidence intervals (solid segments) in the female map.
Figure 1.
Figure 1.
Sex-specific linkage maps of the brown trout genome. Each linkage group (numbered BT-01–BT-37) is represented by a male (left) and a female (right) map derived from the joint analysis of segregation data from families 12, 14, 15, and 17. Roman letters (I–V) in parentheses with linkage group numbers designate pseudolinkage groups. Map distances are indicated in centimorgans to the left of each marker interval (markers within nonrecombinant intervals are shown along the same vertical line). Italicized marker names indicate gene markers, including type I microsatellites and allozymes (shown with an asterisk). A superscript “f” indicates framework markers ordered with high confidence (LOD threshold = 3.0). Markers with multiple copies (denoted as “/i,” “/ii,” and “/iii”) across linkage groups (excluding putative tandem duplications) are shown in boldface type. Markers used for the orientation of linkage groups with respect to the centromere are indicated with a superscript “c” and the position of centromeres is represented by 95% confidence intervals (solid segments) in the female map.
Figure 2.
Figure 2.
Conservation of syntenic blocks in brown trout and other salmonid species. Each cell represents a pairwise comparison of linkage groups between brown trout (rows) and one of three salmonid species (columns), namely Atlantic salmon (A), rainbow trout (B), and Arctic char (C). Linkage groups are numbered according to the nomenclature currently in use for each species (see materials and methods). Solid cells indicate comparisons with at least two common markers between linkage groups (syntenic homologies).
Figure 2.
Figure 2.
Conservation of syntenic blocks in brown trout and other salmonid species. Each cell represents a pairwise comparison of linkage groups between brown trout (rows) and one of three salmonid species (columns), namely Atlantic salmon (A), rainbow trout (B), and Arctic char (C). Linkage groups are numbered according to the nomenclature currently in use for each species (see materials and methods). Solid cells indicate comparisons with at least two common markers between linkage groups (syntenic homologies).

Similar articles

Cited by

References

    1. Allendorf, F. W., and R. G. Danzmann, 1997. Secondary tetrasomic segregation of MDH-B and preferential pairing of homeologues in rainbow trout. Genetics 145: 1083–1092. - PMC - PubMed
    1. Allendorf, F. W., and G. H. Thorgaard, 1984. Tetraploidy and the evolution of salmonid fishes, pp. 1–46 in Evolutionary Genetics of Fishes, edited by B. J. Turner. Plenum Press, New York.
    1. Allendorf, F. W., F. M. Utter and B. P. May, 1975. Gene duplication within the family Salmonidae: detection and determination of the genetic control of duplicate loci through inheritance studies and examination of populations, pp. 415–431 in Isozymes, Vol. IV: Genetics and Evolution, edited by C. L. Markert. Academic Press, New York.
    1. Allendorf, F. W., J. E. Seeb, K. L. Knudsen, G. H. Thorgaard and R. F. Leary, 1986. Gene-centromere mapping of 25 loci in rainbow trout. J. Hered. 77: 307–312.
    1. Broman, K. W., J. C. Murray, V. C. Sheffield, R. L. White and J. L. Weber, 1998. Comprehensive human genetic maps: individual and sex-specific variation in recombination. Am. J. Hum. Genet. 63: 861–869. - PMC - PubMed

Publication types