. 2006 Feb 1;66(3):1712-20.
doi: 10.1158/0008-5472.CAN-05-3138.

Increased levels of the FoxM1 transcription factor accelerate development and progression of prostate carcinomas in both TRAMP and LADY transgenic mice

Affiliations

Increased levels of the FoxM1 transcription factor accelerate development and progression of prostate carcinomas in both TRAMP and LADY transgenic mice

Tanya V Kalin et al. Cancer Res. .

Abstract

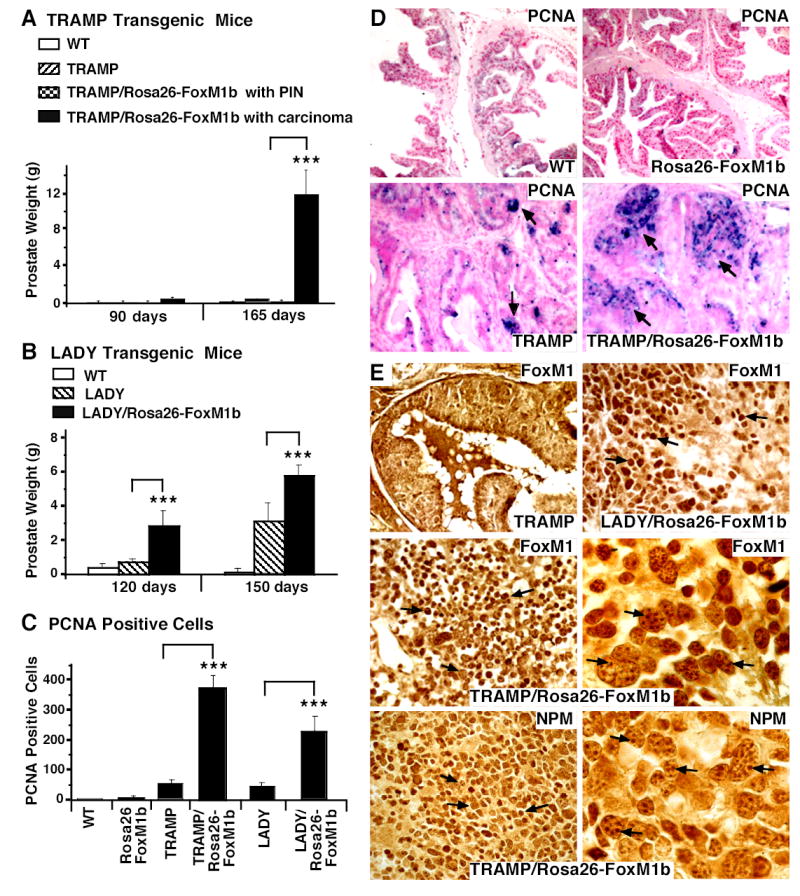
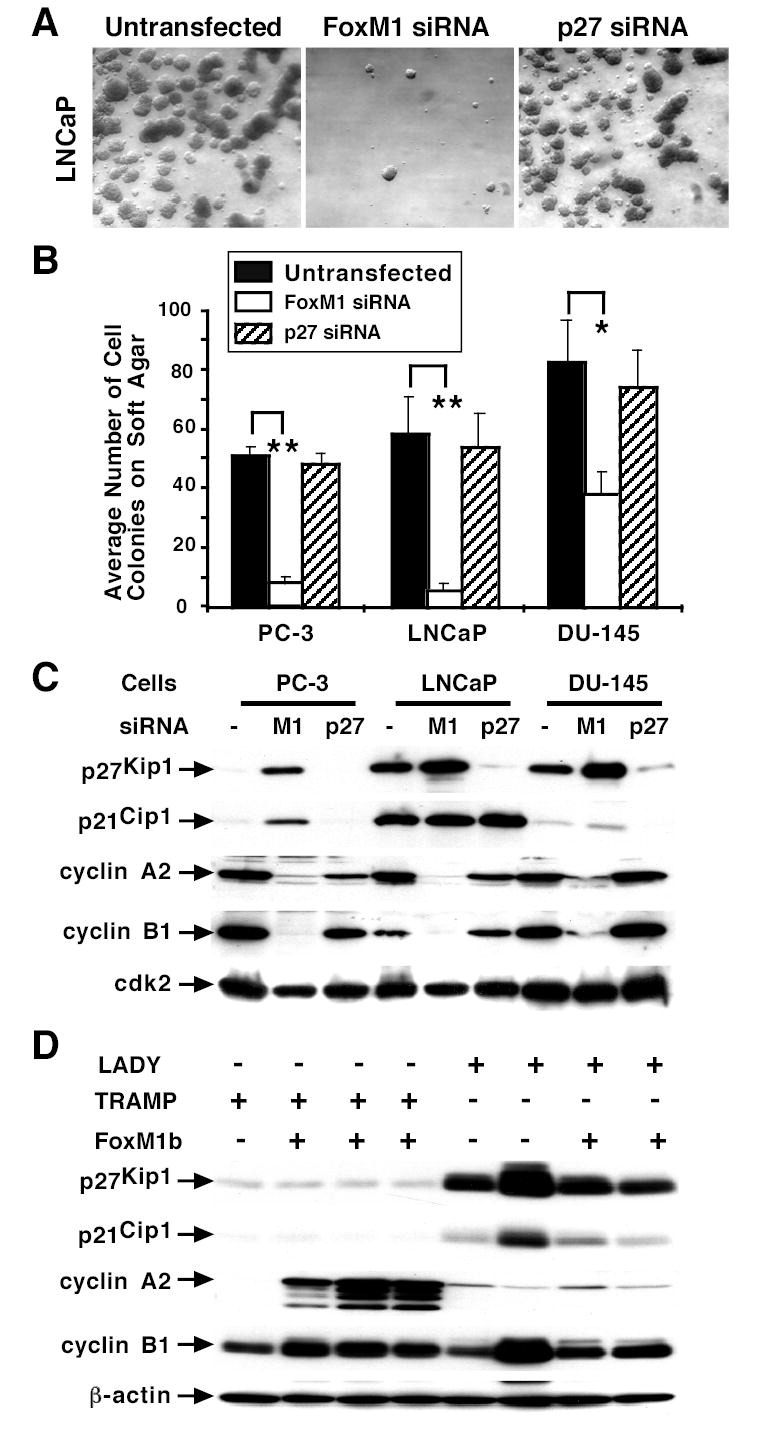
The proliferation-specific Forkhead Box M1 (FoxM1 or FoxM1b) transcription factor is overexpressed in a number of aggressive human carcinomas. Mouse hepatocytes deficient in FoxM1 fail to proliferate and are highly resistant to developing carcinogen-induced liver tumors. We previously developed a transgenic (TG) mouse line in which the ubiquitous Rosa26 promoter was used to drive expression of the human FoxM1b cDNA transgene in all mouse cell types. To investigate the role of FoxM1b in prostate cancer progression, we bred Rosa26-FoxM1b mice with both TRAMP and LADY TG mouse models of prostate cancer. We show that increased expression of FoxM1b accelerated development, proliferation, and growth of prostatic tumors in both TRAMP and LADY double TG mice. Furthermore, development of prostate carcinomas in TRAMP/Rosa26-FoxM1b double TG mice required high levels of FoxM1 protein to overcome sustained expression of the alternative reading frame tumor suppressor, a potent inhibitor of FoxM1 transcriptional activity. Depletion of FoxM1 levels in prostate cancer cell lines PC-3, LNCaP, or DU-145 by small interfering RNA transfection caused significant reduction in proliferation and anchorage-independent growth on soft agar. This phenotype was associated with increased nuclear levels of the cyclin-dependent kinase inhibitor protein p27(Kip1) and diminished expression of S-phase promoting cyclin A2 and M-phase promoting cyclin B1 proteins. Finally, we show that elevated levels of FoxM1 protein correlate with high proliferation rates in human prostate adenocarcinomas. Our results suggest that the FoxM1 transcription factor regulates development and proliferation of prostate tumors, and that FoxM1 is a novel target for prostate cancer treatment.


Figures

Fig. 1
Fig. 1. FoxM1 is expressed in highly proliferative human prostate adenocarcinomas.
Prostate cancer tissue arrays (US Biomax; Cat No. PR801) were immunostained with FoxM1 antibody as described in Materials and Methods. (A) Increased nuclear levels of FoxM1b protein in human prostate adenocarcinomas (right panel) compared to corresponding adjacent normal prostate tissue (left panel). (B) FoxM1 and PCNA are co-expressed in human prostate adenocarcinomas. Adjacent paraffin sections of the prostate cancer tissue array were stained with antibody specific to either FoxM1 (left panels) or PCNA (right panels) proteins. Prostate cancer tumor sections immunostained for PCNA expression were counterstained with nuclear fast red (PCNA staining regions indicated by arrows). (C) FoxM1-negative tumor (left panel) displays diminished PCNA levels (right panel). (D) Correlation between PCNA and FoxM1 staining in human prostate carcinomas. We counted the number of Foxm1 and PCNA positive nuclei in five fields of proliferating human prostate adenocarcinomas or normal prostate tissue. Graphic representation of the mean number of nuclei staining positive for either Foxm1 or PCNA ± SD in proliferating human adenocarcinomas versus normal prostate tissue (***P<0.001). Magnification: A, 200x; B and C, 50x.
Fig. 2
Fig. 2. TRAMP/Rosa26-FoxM1b and LADY/Rosa26-FoxM1b double transgenic mice exhibit accelerated growth and development of prostate carcinomas.
We sacrificed TRAMP and LADY single transgenic (TG) or TRAMP/Rosa26-FoxM1b and LADY/Rosa26-FoxM1b double TG mice at the indicated time points. Prostate glands were collected and weighed from wild type (WT; n=4), Rosa26-FoxM1b (n=7), TRAMP (n=7) and LADY (n=7) single TG mice and TRAMP/Rosa26-FoxM1b (n=12) and LADY/Rosa26-FoxM1b (n=10) double TG mice. Prostate tissue sections were immunochemically stained with antibody specific to either the Proliferation Cell Nuclear Antigen (PCNA) or the FoxM1 protein. (A) Graphically shown are the weights of prostate glands containing carcinomas from TRAMP/Rosa26-FoxM1b double TG mice compared to those of TRAMP TG mice. We determined the mean weight of mouse prostate gland ± SE. Prostate weight is significantly increased in the subset of TRAMP/Rosa26-FoxM1b double TG mice that developed prostate carcinomas compared to dual or single TRAMP TG mice that developed PIN. (B) Statistically significant increase in weight of prostate glands from LADY/Rosa26-FoxM1b double TG mice compared to those of LADY single TG mice. We determined the mean weight of mouse prostate glands ± SE. (C) Elevated number of PCNA positive cells in TRAMP/Rosa26-FoxM1b and LADY/Rosa26-FoxM1b double TG mice. Prostate tumor cells undergoing proliferation were detected with antibody specific to PCNA and prostate tumor sections were then counterstained with nuclear fast red (panel D). We counted the number of PCNA-positive cells in 5 random microscope fields from different mouse prostates to determine the mean number of PCNA positive cells ± SD. The asterisks in panels A, B and C indicate statistically significant increases with P values calculated by Student T Test: *P <0.05, **P ≤ 0.01 and ***P ≤ 0.002. (E) Nucleolar localization of FoxM1 protein in mouse prostate tumors from TRAMP/Rosa26-FoxM1b double TG mice. Prostate tissue sections from TRAMP, TRAMP/Rosa26-FoxM1b and LADY/Rosa26-FoxM1b double TG mice were immunostained with antibody specific to either FoxM1 protein or the nucleolar Nucleophosmin (NPM) protein (49, 50). High magnification of FoxM1 staining in prostate carcinoma cells from TRAMP/Rosa26-FoxM1b double TG mice shows partial nucleolar staining of FoxM1 protein (right middle panel), which is similar to the nucleolar staining pattern of the NPM protein (right lower panel). The nucleolar staining pattern is indicated in these two panels by arrows. Magnification: D and E, 100x; right middle and right lower panels of panel E, 630X.
Figure 3
Figure 3. Significant increase in FoxM1 mRNA levels and sustained ARF tumor suppressor mRNA expression in prostate carcinomas.
(A) A 6-fold increase in FoxM1 mRNA levels was found in prostate carcinomas compared to PIN in TRAMP/Rosa26-FoxM1b double TG mice. Total RNA was prepared from either prostate carcinomas (CaP) or prostatic intraepithelial neoplasia (PIN) in TRAMP/Rosa26-FoxM1b and LADY/Rosa26-FoxM1b double TG mice and TRAMP or LADY single TG mice. We also prepared total RNA from normal prostate tissue from wild type (WT) and Rosa26-FoxM1b transgenic (TG) mice. To determine relative levels of FoxM1 mRNA, Quantitative Real-time reverse transcriptase (QRT)-PCR was performed with RNA from either prostate tissue, carcinoma or PIN and FoxM1 specific primers. (B) Prostate carcinomas in TRAMP/Rosa26-FoxM1b TG mice exhibit sustained expression of ARF tumor suppressor mRNA. Total RNA was prepared from either prostate carcinomas or PIN in TRAMP/Rosa26-FoxM1b double TG mice and analyzed for mRNA levels of the ARF tumor suppressor by QRT-PCR using primers specific to mouse ARF gene. Note that ARF mRNA levels in these prostate tumors were significantly less than those found in early passage FoxM1 − /− mouse embryonic fibroblasts (MEFs) (Fig. 3B), which undergo premature senescence and express high levels of nuclear ARF protein (42). Levels of Cyclophilin mRNA were used to normalize expression levels of FoxM1 and ARF mRNA as described in Materials and Methods. The asterisks indicate statistically significant increases with P values calculated by Student T Test: *P <0.05, **P ≤ 0.01 and ***P ≤ 0.001.
Fig. 4
Fig. 4. FoxM1 is essential for growth and proliferation of PC-3, LNCaP and DU-145 prostate cancer cell lines.
We transfected siRNA duplexes specific to either FoxM1 (siFoxM1 #2) or p27Kip1 (siP27) into PC-3, LNCaP and DU-145 prostate cancer cell lines and at 48 hours after transfection they were used for growth or flow cytometry analysis and at 72 hours after transfection they were used to prepare total RNA. (A) Transfection of FoxM1 siRNA inhibits expression of FoxM1 in PC-3, LNCaP and DU-145 cells. Total RNA was prepared from prostate cancer cell lines PC-3, LNCaP and DU-145 at 48 hours after transfection with either siRNA duplexes specific to FoxM1 (siFoxM1 #2) or p27Kip1 (siP27) or left untransfected and then was analyzed for expression levels of FoxM1 and Cyclophilin by quantitative Real-Time RT-PCR (QRT-PCR) as described in Material and Methods. FoxM1 mRNA levels in each individual sample were normalized to its corresponding Cyclophilin mRNA level. (B) Transfection of FoxM1 siRNAs into prostate cancer cell lines decreases their growth in culture. Prostate cancer cell lines PC-3, LNCaP and DU-145 were transfected with either siFoxM1 #2 or siP27 duplexes or left untransfected and were then re-plated 48 hours after siRNA transfection and cell numbers were counted at day 3, day 4 or day 5 after transfection. A statistically significant decrease in the growth of FoxM1 depleted prostate cancer cells compared to untransfected cells. (C) Flow cytometry analysis of FoxM1 depleted prostate cancer cell lines shows decreased S-phase progression. The indicated prostate cancer cell lines were transfected with siFoxM1 #2 or siP27 duplexes or left untransfected and then subjected to flow cytometry analysis at 72 hours post transfection after staining with propidium iodide. Graphically shown is the percentage of cells accumulating in G1, S, and G2/M (4N) in FoxM1 or p27Kip1 depleted prostate cancer cells compared to untransfected prostate cancer cells ± SD in triplicate. The asterisks indicate statistically significant increases with P values calculated by Student T Test: *P <0.05, **P ≤ 0.01 and ***P ≤ 0.001.
Figure 5
Figure 5. Depletion of FoxM1 reduces anchorage-independent growth of prostate cancer cell colonies on soft agar.
The prostate cancer cell lines PC-3, LNCaP and DU-145 were transfected with 100 nM of either siFoxM1 #2 or siP27 duplexes or left untransfected. One day after transfection, the cells were trypsinized and plated on soft agar for three weeks to analyze the anchorage-independent cell growth as described previously (32). (A) Representative micrographs of LNCaP prostate cancer cell colonies on soft agar after transfection with the indicated siRNA or left untransfected. (B) Graphic presentation of the number of prostate cancer cell colonies that grew on soft agar with or without depletion of FoxM1 or p27Kip1 protein levels. Triplicate plates were used to count the number of cell colonies and determine the mean number of colonies that grew on soft agar ± standard deviation (SD). FoxM1 depleted PC-3 (**P= 0.003), LNCaP (**P = 0.007), or DU-145 (*P= 0.03) prostate cancer cells displayed a statistically significant decrease in the number of cell colonies that grew on soft agar compared to untransfected or siP27 transfected controls. (C) FoxM1 depleted prostate cancer cell lines exhibit increased nuclear levels of CDKI proteins and diminished expression of cyclin A2 and cyclin B1 protein. PC-3, LNCaP, or DU-145 prostate cancer cells were transfected with siFoxM1 #2 or siP27 duplex or left untransfected (-) and nuclear extracts were prepared at 72 hours following transfection and analyzed for nuclear levels of p21Cip1, p27Kip1, cyclin A2 and cyclin B1 proteins by Western blot analysis. The protein levels of cdk2 were used as a loading control. (D) Increased proliferation in TRAMP/Rosa26-FoxM1b prostate carcinomas correlates with elevated expression of cyclin A2. Expression of p21Cip1, p27Kip1, cyclin A2 and cyclin B1 proteins was determined by Western blot analysis with prostate tissue extracts isolated at later time points from TRAMP or LADY single TG mice and TRAMP/Rosa26-FoxM1b or LADY/Rosa26-FoxM1b double TG mice.

References

    1. McCormick F. Signalling networks that cause cancer. Trends Cell Biol. 1999;9(12):M53–M6. - PubMed
    1. Franke TF, Hornik CP, Segev L, Shostak GA, Sugimoto C. PI3K/Akt and apoptosis: size matters. Oncogene. 2003;22(56):8983–98. - PubMed
    1. Sherr CJ, McCormick F. The RB and p53 pathways in cancer. Cancer Cell. 2002;2(2):103–12. - PubMed
    1. Massague J. G1 cell-cycle control and cancer. Nature. 2004;432(7015):298–306. - PubMed
    1. Sherr CJ, Roberts JM. CDK inhibitors: positive and negative regulators of G1-phase progression. Genes Dev. 1999;13(12):1501–12. - PubMed

Publication types

MeSH terms