. 2006 Feb;188(4):1266-78.
doi: 10.1128/JB.188.4.1266-1278.2006.

CcpA causes repression of the phoPR promoter through a novel transcription start site, P(A6)

Affiliations

CcpA causes repression of the phoPR promoter through a novel transcription start site, P(A6)

Ankita Puri-Taneja et al. J Bacteriol. 2006 Feb.

Abstract

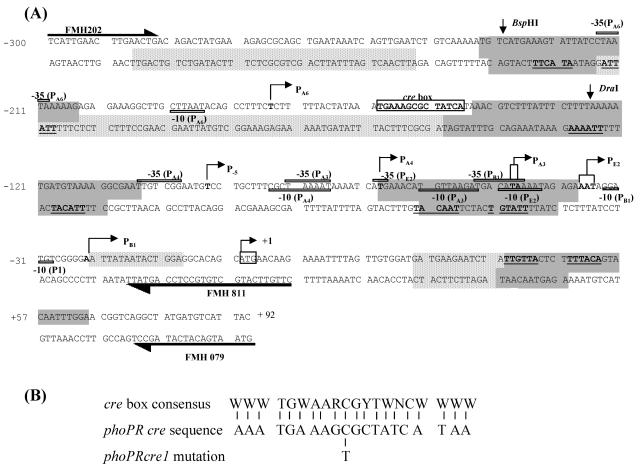
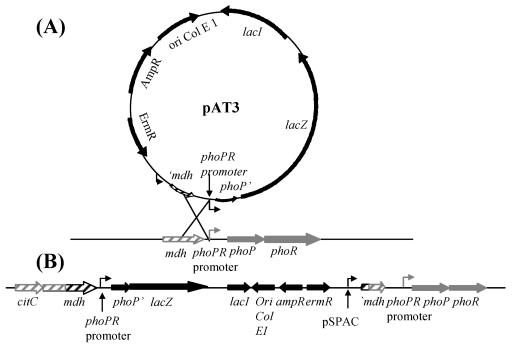
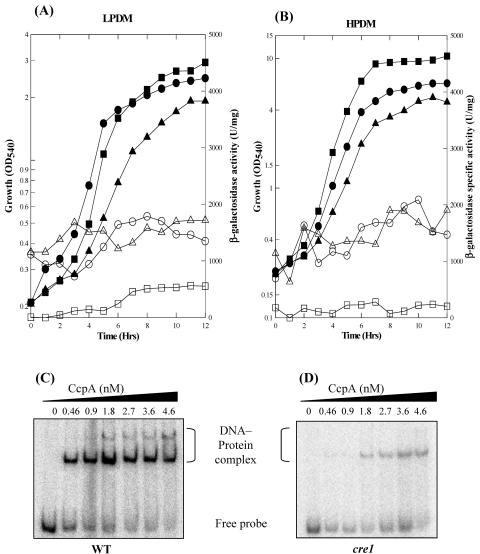
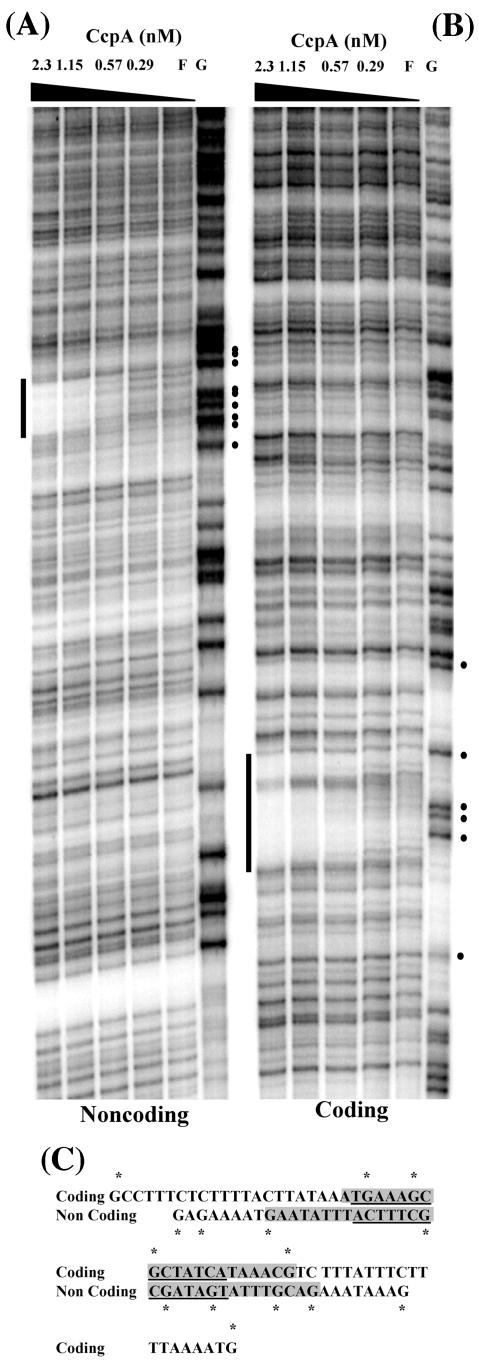
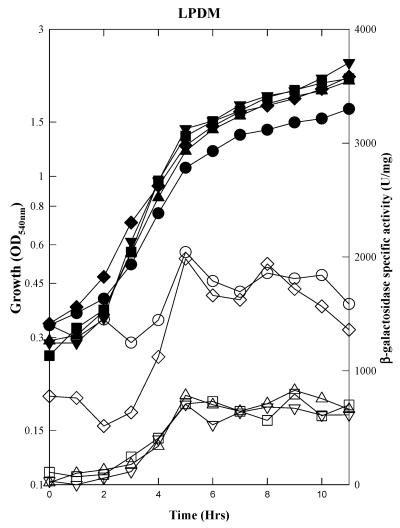
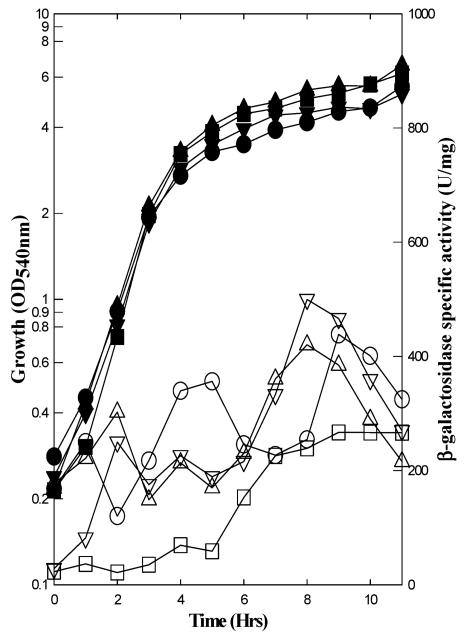
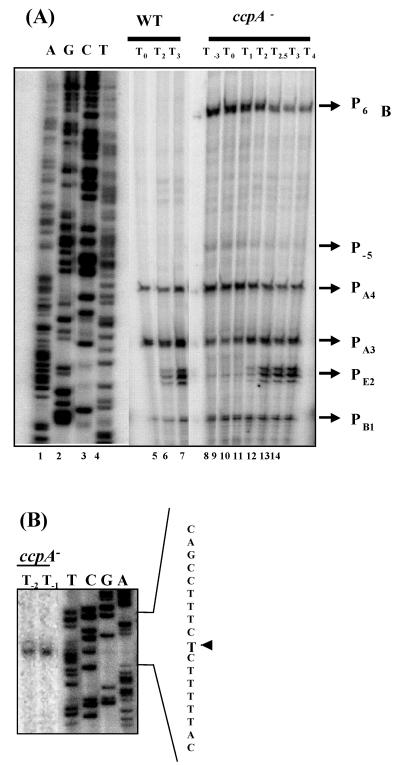
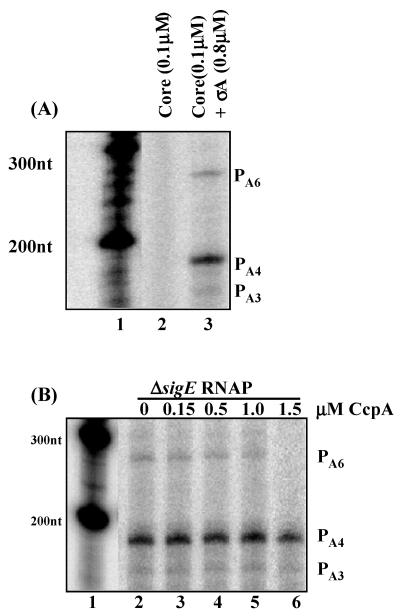
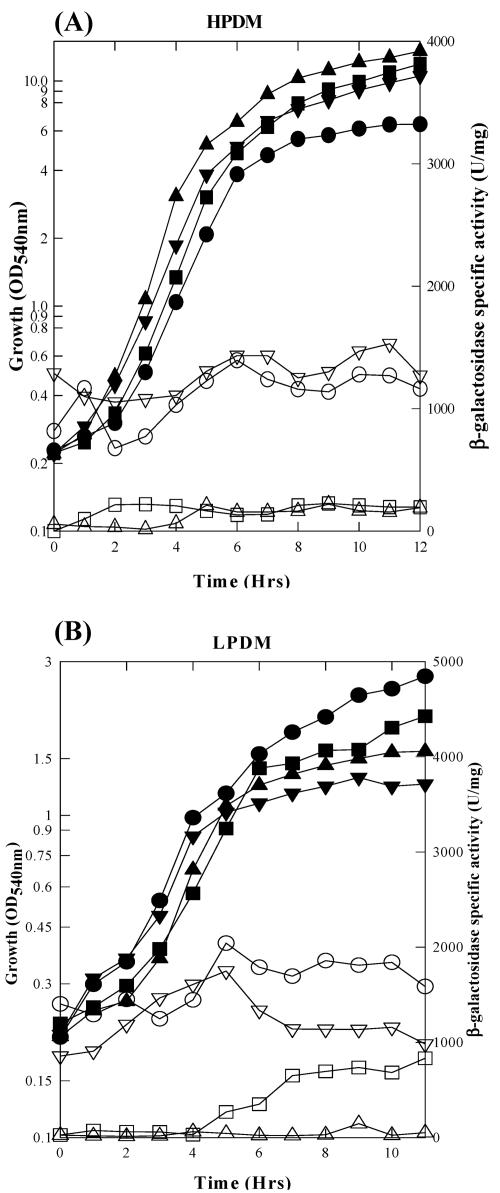
The Bacillus subtilis PhoPR two-component system is directly responsible for activation or repression of Pho regulon genes in response to phosphate deprivation. The response regulator, PhoP, and the histidine kinase, PhoR, are encoded in a single operon with a complex promoter region that contains five known transcription start sites, which respond to at least two regulatory proteins. We report here the identification of another direct regulator of phoPR transcription, carbon catabolite protein A, CcpA. This regulator functions in the presence of glucose or other readily metabolized carbon sources. The maximum derepression of phoPR expression in a ccpA mutant compared to a wild-type stain was observed under excess phosphate conditions with glucose either throughout growth in a high-phosphate defined medium or in a low-phosphate defined medium during exponential growth, a growth condition when phoPR transcription is low in a wild-type strain due to the absence of autoinduction. Either HPr or Crh were sufficient to cause CcpA dependent repression of the phoPR promoter in vivo. A ptsH1 (Hpr) crh double mutant completely relieves phoPR repression during phosphate starvation but not during phosphate replete growth. In vivo and in vitro studies showed that CcpA repressed phoPR transcription by binding directly to the cre consensus sequence present in the promoter. Primer extension and in vitro transcription studies revealed that the CcpA regulation of phoPR transcription was due to repression of P(A6), a previously unidentified promoter positioned immediately upstream of the cre box. Esigma(A) was sufficient for transcription of P(A6), which was repressed by CcpA in vitro. These studies showed direct repression by CcpA of a newly discovered Esigma(A)-responsive phoPR promoter that required either Hpr or Crh in vivo for direct binding to the putative consensus cre sequence located between P(A6) and the five downstream promoters characterized previously.


Figures

FIG. 1.
FIG. 1.
(A) phoPR promoter sequence and 5′ PhoP coding sequence showing the various transcription start sites and PhoP binding sites. Gray shading identifies the region protected by both PhoP and PhoP∼P. Stippled shading identifies the sequence protected only by PhoP∼P. Transcription start sites for PB1, PE2, PA3, PA4, P5 and PA6 are indicated by bold sequences that are identified by a bent arrow followed by the promoter number. The letters in each promoter name, B, E, and A, stand for EσB, EσE, and EσA, respectively. The −10 and −35 sites are also marked for each promoter. The consensus repeats for PhoP dimer binding, TT(A/C/T)A(C/T)A, are underlined with the sequence in bold print. The translational start codon ATG is boxed and identified by a bent arrow marked +1. Sequence numbering is relative to the A of ATG as +1. Arrows with half arrowheads identify primers used in primer extension and/or in vitro transcription. The DraI and BspHI sites indicate the restriction sites used for creating fragments for gel shift assays. The conserved cre box sequence is boxed and labeled. (B) Comparison of cre box consensus sequence and phoPR cre box sequence. 3′ and 5′ A+T-rich regions are separated from the cre sequence by a space. The mutation created in the cre box is shown. Symbols for nucleotides in the consensus sequence: W, A or T; R, A or G; Y, C or T; N, A, G, C, or T.
FIG. 2.
FIG. 2.
Isotopic Campbell insertion of the phoP-lacZ fusion from a pMUTIN2 construct into the B. subtilis genomic DNA. (A) Structure of pAT3. Single crossover through homologous recombination between plasmid DNA and genomic DNA. (B) Resultant insertion into the genomic DNA after the recombination event. The plasmid DNA is shown in black and the genomic DNA is shown in gray. Genes are shown as thick arrows, phoP and phoR are in solid colors and the mdh (citH) gene is shown in stripes. The promoters are shown as broken arrows.
FIG. 3.
FIG. 3.
Effect of ccpA null mutation or a cre box mutation on phoPR transcription in (A) LPDM and (B) HPDM. Each medium is supplemented with amino acids to support ccpA strain growth. The cells were cultured and the readings were taken for 12 h. Solid symbols represent growth and open symbols represent β-galactosidase specific activity of the phoPR-lacZ fusion in each strain, wild type (MH6024, □); ccpATn917 (MH6025, ○); phoPR cre1-lacZ (MH6040, ▵). (C) EMSA for phoPR promoter fragment with wild-type cre box with CcpA. (D) Promoter with phoPRcre1 type mutation. The promoter fragment in both cases is a 109-bp BspHI-DraI fragment from the phoPR promoter. Restriction site positions and sequences are given in Fig. 1.
FIG. 4.
FIG. 4.
DNase I footprinting of the phoPR promoter by CcpA. Labeled DNA fragments are the PCR products using primers FMH464 and FMH465, with pSB5 as the template. The CcpA concentration (nM) is shown at the top of each lane. F, free of CcpA; G, Maxam-Gilbert G-sequencing reaction lane as a marker. (A) Footprinting on the noncoding strand. End-labeled FMH465 was used to create the probe. (B) Footprinting on the coding strand. End-labeled FMH464 was used to create the probe. (C) Sequence showing the region protected by CcpA shown as a shaded area. The cre box sequence is underlined on both the coding and the noncoding sequence. * indicates the dotted G's on the marker lanes from A and B.
FIG. 5.
FIG. 5.
Effect of a ptsH1 or crh or ptsH1 crh double mutations on phoPR promoter expression. Solid symbols are growth and open symbols are β-galactosidase specific activity of the phoPR-lacZ fusion in each strain. All the strains were grown in LPDM over a period of 12 h. Wild type (MH6024, □); ccpA Tn917 (MH6025, ○); ptsH1 (MH6033, ▵); crh SpcR (MH6032, ▿); ptsH1 crh Spcr (MH6034, ◊).
FIG. 6.
FIG. 6.
Effect of alternate carbon sources on phoPR transcription. All strains were grown in LPCM for 11 h. Solid symbols represent growth and open symbols represent β-galactosidase specific activity of the phoPR-lacZ fusion in each strain. Wild-type (MH6024) with glucose, □; ccpA (MH6025) with glucose, ○; wild type with lactate, ▵; wild type with succinate, ▿.
FIG. 7.
FIG. 7.
Primer extension analysis using RNA from a ccpA mutant strain shows appearance of a new 5′ mRNA end in the phoPR promoter region. (A) Primer extension of the phoPR promoter. Lanes 1 to 4 are the sequencing ladder. Lanes 5 to 7 are the primer extension of RNA samples taken from a wild-type strain growing in LPDM at times T0, T2, and T3, respectively. T0 is the time of Pho induction and T2 and T3 are 2 and 3 h, respectively, after Pho induction. Lanes 8 to 14 are primer extension of RNA samples grown in LPDM at times between T3 and T4. The positions of all the promoter start sites are given by arrows labeled PB1, PE2, PA3, PA4, and P-5, and P6 identifies the mRNA5′ ends. Primer FMH079 was used (Fig. A1). (B) Portion of the primer extension enlarged to show the position of PA6 on the phoPR promoter. RNA from a ccpA mutant strain at times T2 and T1 was used. Primer FMH811 (Fig. 1) was used for better resolution of the 5′ mRNA location.
FIG. 8.
FIG. 8.
Core RNAP plus σA is sufficient for in vitro transcription of PA6. (A) In vitro transcription using core RNAP alone or core plus σA. Lane 1: marker; lane 2: in vitro transcription with core RNAP alone; lane 3: in vitro transcription with core and σA. (B) In vitro transcription of PA6 in the presence of CcpA. All reactions were done with RNAP holoenzyme (0.4 μM) isolated from a ΔsigE strain. Lane 1: marker; lanes 2 to 6: in vitro transcription reactions performed in the presence of increasing amounts of CcpA.
FIG. 9.
FIG. 9.
Absence of PhoP-PhoR in phoPR ccpA double mutant affects phoPR transcription specifically during phosphate-limited growth. (A) HPDM. (B) LPDM. Solid symbols represent growth and open symbols represent β-galactosidase specific activity of the phoPR-lacZ fusion in each strain. Wild-type (MH6024), □; ccpA (MH6025), ○; phoPR (MH6069), ▵; phoPR ccpA (MH6070), ▿.
FIG. 10.
FIG. 10.
Model for the coordinated regulation of B. subtilis Pho, Res, and carbon catabolite regulation responses during Pi-starved growth conditions. Solid lines represent a direct role in transcriptional activation (with arrowheads) or repression (with flat heads). The activated and repressed genes are indicated above lines. Dashed lines indicate the indirect role of ResD (via terminal oxidases) in full Pho activation. (A) Phosphate starvation in the presence of 2% glucose. Relatively low concentrations of active PhoPR and ResDE proteins activate the transcription of the resABC/DE operon to provide sufficient active ResDE to induce genes required for terminal oxidase synthesis (OX). Terminal oxidases oxidize the reduced quinones (QH2), an inhibitor of PhoR autophosphorylation activity (50). Three CcpA-activated genes, phosphotransacetylase (pta), acetate kinase (ackA), and acetoin biosynthesis operon (alsSD), that are involved in the carbon overflow metabolism provide the primary dissipating flux of ATP equivalents and contribute to low carbon flux through the TCA cycle during phosphate starvation. Direct and indirect repression of certain TCA genes by CcpA may contribute further to low carbon flux through the TCA cycle. Thus, CcpA provides a fine-tuning mechanism for terminal oxidase synthesis via direct repression of the phoPR PA6 promoter to provide sufficiently active terminal oxidases to accommodate the low flux of reducing equivalents. Balance refers to balancing total cellular energy flux based on conversion of energy and energy equivalents (8). (B) Phosphate and carbon starvation in the absence or presence of poorly metabolized C sources. CcpA no longer activates the carbon overflow metabolism, leading to higher carbon flow through the TCA cycle. In order to accommodate the increased reducing equivalents produced from the TCA cycle, the CcpA-mediated repression of the PhoPR-ResDE positive feedback loop involving terminal oxidase synthesis is released. The line thickness in B depicts the increased activities caused by CcpA inactivation compared to that in A, when CcpA is active.

Similar articles

Cited by

References

    1. Abdel-Fattah, W. R., Y. Chen, A. Eldakak, and F. M. Hulett. 2005. Bacillus subtilis phosphorylated PhoP: direct activation of the EσA and repression of the EσE-responsive phoB PS+V promoters during Pho response. J. Bacteriol. 187:5166-5178. - PMC - PubMed
    1. Atkinson, M. R., L. V. Wray, Jr., and S. H. Fisher. 1990. Regulation of histidine and proline degradation enzymes by amino acid availability in Bacillus subtilis. J. Bacteriol. 172:4758-4765. - PMC - PubMed
    1. Belitsky, B. R., H. J. Kim, and A. L. Sonenshein. 2004. CcpA-dependent regulation of Bacillus subtilis glutamate dehydrogenase gene expression. J. Bacteriol. 186:3392-3398. - PMC - PubMed
    1. Birkey, S. M. 1998. Regulation of the phoPR operon of Bacillus subtilis during phosphate starvation and sporulation. Ph.D. thesis. University of Illinois at Chicago, Chicago, Ill.
    1. Birkey, S. M., W. Liu, X. Zhang, M. F. Duggan, and F. M. Hulett. 1998. Pho signal transduction network reveals direct transcriptional regulation of one two-component system by another two-component regulator: Bacillus subtilis PhoP directly regulates production of ResD. Mol. Microbiol. 30:943-953. - PubMed

Publication types

MeSH terms

LinkOut - more resources