Comparative Study
. 2006 Mar;17(3):637-47.
doi: 10.1681/ASN.2005050534. Epub 2006 Feb 1.

Polycystin-1 induces resistance to apoptosis through the phosphatidylinositol 3-kinase/Akt signaling pathway

Affiliations
Comparative Study

Polycystin-1 induces resistance to apoptosis through the phosphatidylinositol 3-kinase/Akt signaling pathway

Manila Boca et al. J Am Soc Nephrol. 2006 Mar.

Abstract

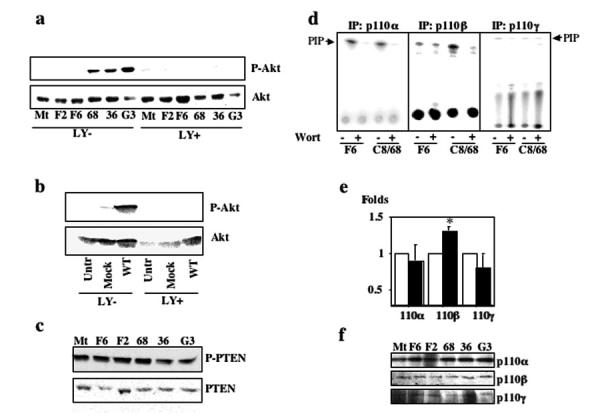
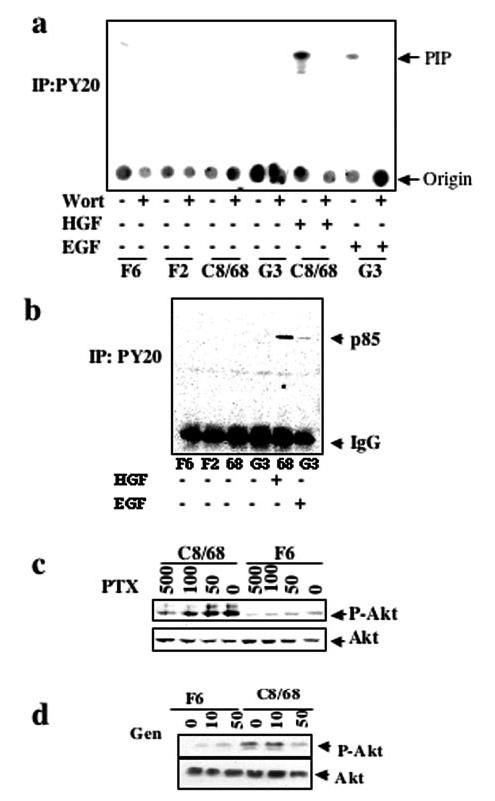
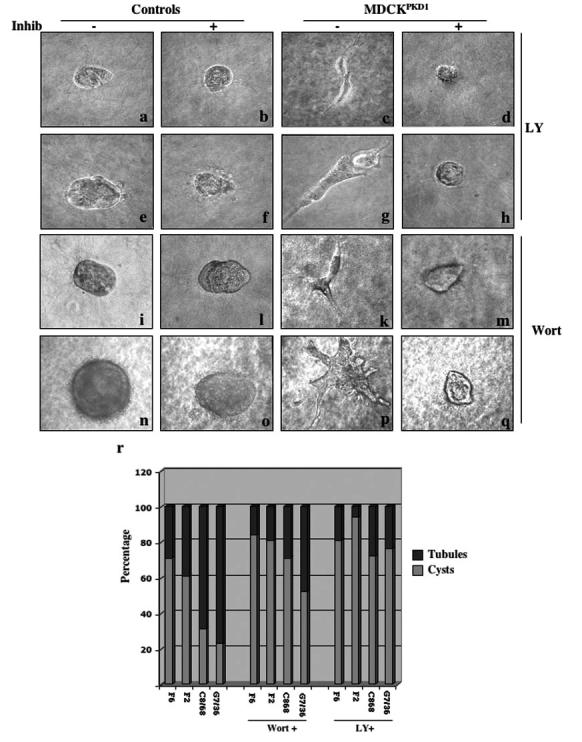
Polycystin-1 (PC-1), the PKD1 gene product, is a large receptor whose expression in renal epithelial cells results in resistance to apoptosis and tubulogenesis, a model consistent with the phenotype observed in patients. This study links PC-1 expression to a signaling pathway that is known to be both antiapoptotic and important for normal tubulogenesis. This study found that PC-1 expression results in phosphorylation of Akt and downstream effectors and that phosphatidylinositol 3-kinase (PI3-K) inhibitors prevent this process. In addition, it is shown that dominant negative Akt can revert PC-1-induced protection from apoptosis. Furthermore, it was observed that increased PI3-K beta activity in PC-1-expressing MDCK cells seems to be dependent on both tyrosine-kinase activity and heterotrimeric G proteins. It also was found that PC-1-induced tubulogenesis is inhibited by PI3-K inhibitors. Taken together, these data suggest that the PI3-K/Akt cascade may be a central modulator of PC-1 function and that its deregulation might be important in autosomal dominant polycystic kidney disease.


Figures

Figure 1
Figure 1
Polycystin-1 (PC-1) expression results in activation of Akt. (a) Immunoblot (IB) analysis of PC-1 expression in immunoprecipitation (IP) products of three MDCKPKD1Zeo (C8/68 [68], G7/36 [36], and G3) and control cell lines (MDCKtTA [Mt], F6, and F2). An anti-PC-1 C-term (α-CT) antibody was used for both IP and IB (7). Open arrows indicate PC-1 (top panel). (Bottom) Cell lysates were tested for Akt activation with either anti-phospho-Ser473-Akt or anti-Thr-308 antibodies. Membranes were stripped and reprobed for total Akt to control for loading. (b) Several truncation constructs (top) described previously (11) were expressed by transient transfection in HepG2 cells. Wild-type (WT): pCI-β-PKD1Flag (7); C-terminal cleavage products (CTF): AF66; REJ-CTF: HBF160; PK-REJ-CTF: BF110 (11). (c) MDCK cells were transiently co-transfected with the constructs shown in b along with green fluorescence protein, sorted using a flow cytometer, and assayed using an anti-phospho-Ser473-Akt antibody. The same membrane then was stripped and reprobed using an anti-Akt antibody. (d) Total lysates from two control cell lines (F6 and F2) and three PC-1-expressing cell lines (C8/68, G7/36, and G3) cultured as in a were immunoblotted using an anti-phospho- Ser256-FKHR antibody. The same gel was stripped and reprobed with an anti-FKHR antibody to control for loading. (Bottom) Immunofluorescence staining performed using an anti-FKHR antibody after 24 h of serum starvation revealed relocation of FKHR in the nucleus in F6 as compared to C8/68. (e) Immunoblot (IB) analysis of PC-1 expression in HepG2 cells transfected with the various PKD1 constructs presented in b. M2 beads were used to purify the FLAG-tagged PC-1 variants from an equal quantity of total cell lysate, and the affinity-purified products were analyzed using α-CT in a 5% polyacrylamide gel. The black arrow identifies the CTF that result from cleavage of WT and mutant PC-1 at the GPS site (11). REJ-CTF (*uncleaved form) is cleaved at a markedly reduced rate, explaining the relatively small amount of CTF present in the corresponding lane (11). In contrast, IgG-REJ-CTF (°uncleaved form) and WT are cleaved in a higher proportion. To better visualize the full-length PC-1 (open arrow), two lanes were loaded with samples from IgG-REJ-PKD1 (°right blot) and wt-PKD1 (open arrow, right blot) in a 4% polyacrylamide gel and analyzed using α-CT. (f) HepG2 cells were transiently transfected, serum starved, and total lysates were assayed using an anti-phospho-Ser473-Akt antibody. The same membrane then was stripped and reprobed using an anti-Akt antibody.
Figure 2
Figure 2
Akt is necessary for PC-1-mediated resistance to apoptosis. (a) MDCK control (F6) and MDCKPKD1Zeo (C8/68) were transiently transfected using a mock, a WT (WT-Akt), or a dominant negative (DN_Akt) Akt construct. Apoptosis was induced using TNF-α (see Materials and Methods), and cells were stained with an anti-hemagglutin (HA) antibody (in red) to identify transfected cells, with a transferase-mediated dUTP nick-end labeling (TUNEL) assay (in green) to visualize apoptotic cells and counterstained with Hoechst 33342 (blue nuclei) to visualize all of the cells that were present in the field. Very few apoptotic cells are visible in mock-transfected C8/68 cells, whereas a considerable number are visible in F6 cells that are treated under the same conditions. Similar results were observed when the WT-Akt construct was transfected in these two cell lines, whereas higher rates of HA-positive/TUNEL-positive cells are visible in C8/68 when DN-Akt is transfected in these cells. (b) Same experimental design as in a except that cell lysates were prepared from transiently transfected F6 and C8/68 cells and analyzed by Western blot using a mixture of anti-HA and anti-actin antibodies as a loading control. Equal expression levels were achieved with all constructs in all cell lines. (c) Quantification of the results visualized in a. In mock-transfected cells, the percentage of apoptosis is calculated as the number of TUNEL-positive cells over the number of total cells present in the field. In WT-and DN-Akt-transfected cells, the percentage of apoptosis is expressed as the number of TUNEL-positive cells over the number of HA-positive cells. The ANOVA test was used to perform statistical analysis. The results for each pairwise comparison reached statistical significance (see text for details). (d) Same experiment as in a through c performed in HepG2 cells. Both the percentage of apoptosis and the statistical analysis were performed as in c.
Figure 3
Figure 3
PC-1 associated activation of Akt is phosphatidylinositol 3-kinase (PI3-K) dependent, and PI3-Kβ has increased activity in MDCKPKD1Zeo cell lines. (a) Lysates from MDCK control (1, MDCKtTA; 2, F6; 3, F2) and MDCKPKD1Zeo cell lines (4, C8/68; 5, G7/36; 6, G3), treated with serum starvation in the presence (LY+) or absence (LY-) of LY29400 (15 μM final), were immunoblotted using an antibody specific for phospho-Ser473-Akt (top). The same membrane was stripped and reprobed using an anti-Akt antibody (bottom). (b) Same experimental design as in a except that the lysates were prepared from HepG2 cells that were transfected with PKD1 (WT) and transfected with vector (Mock) and from untransfected controls. (c) The same MDCK control and MDCKPKD1Zeo cell lines described in a were serum starved for 24 h, and then cell lysates were assayed using an anti-phospho-Ser380-PTEN antibody and an anti-PTEN antibody. (d) Analysis of PI3-K activity. MDCK control F6 and MDCKPKD1Zeo C8/68 cell lines were serum-deprived for 36 h and then lysed. Each of the class I p110 subunits was immunoprecipitated with a suitable antibody, and then its PI3-K activity was measured in either the absence (-) or the presence (+) of Wortmannin (25 nM final) as described in Materials and Methods. Only the p110β IP product had increased activity. Similar results were obtained using the other negative control MDCK (Mt and F2) and MDCKPKD1Zeo (G3 and G7/36) cell lines (data not shown). (e) Quantification of in vitro PI3-K assays performed using lysates of all three negative control MDCK (□) and three MDCKPKD1Zeo cell lines (■). The level of activity observed in controls was set at a value of 1, whereas the activity that was observed in MDCKPKD1Zeo cells was expressed as a ratio over that of the controls. The assay for p110β activity was performed in six independent experiments, whereas that for p110α and p110γ was repeated three times. Results are expressed as the average ± SEM. *Statistically significant differences (P = 0.0019; t test unpaired). (f) Expression level of PI3-K p110 subunits in the same MDCK control (Mt, F6, and F2) and MDCKPKD1Zeo (C8/68, G7/36, G3) cell lines used in b. The products were immunoprecipitated and subjected to immunoblot analysis using the same subunit-specific antibody.
Figure 4
Figure 4
Activated PI3-Kβ is not associated with phospho-tyrosine and is inhibited by pertussis toxin (PTX). (a) Analysis of PI3-K activity of anti-phospho-tyrosine (PY20) immunoprecipitates from MDCK control or MDCKPKD1Zeo cells either in the absence (-) or the presence (+) of Wortmannin (25 nM final) using the same protocol as in Figure 3. Some cultures were treated with hepatocyte growth factor (HGF) or EGF for 5 min before cell harvesting, as indicated, as positive controls. PIP identifies the 32P-labeled phosphatidylinositols. (b). An aliquot of each of the immunoprecipitates used in a was subjected to immunoblot analysis using an anti-p85 antibody (see Materials and Methods). Increased levels of p85 were immunoprecipitated by anti-phosphotyrosine antibodies upon treatment with HGF or EGF but not in untreated cells. (c) The control cell line F6 and the PC-1-expressing clone C8/68 were serum starved for 24 h in the presence or absence of 0, 50, 100, or 500 ng/ml PTX. Cell lysates were immunoblotted using the anti-phospho-Ser473-Akt antibody. Membranes were stripped and reprobed using an anti-Akt antibody. (d) Experimental design similar to that used in c except that genistein was used at the doses (mm) shown.
Figure 5
Figure 5
PI3-K inhibition prevents PC-1-induced tubulogenesis. (a through q) PC-1-induced tubulogenesis is inhibited by PI3-K inhibition. MDCK and MDCKPKD1Zeo cell lines were grown suspended in a collagen gel as described previously (22) either in the absence (-) or the presence (+) of 15 μM LY294002 or 25 nM Wortmannin for 2 d (a through d and I through m), 4 d (e through h), or 8 d (n through q). Representative examples of the control cell lines (a, b, e, f, i, l, n, and o) and MDCKPKD1Zeo cell lines (c, d, g, h, k, m, p, and q) are shown. Photographs were taken at ×40 magnification; a through m were magnified further ×4. (r) Quantification of the experiments described in a was performed as described previously (22). The structures observed in three to five wells for each clone were counted. Treatment in the presence of 15 μM LY294002 or 25 nM Wortmannin dramatically reduced, although not completely suppressed, the total number of tubules observed in MDCKPKD1Zeo cultures.

References

    1. Gabow PA Autosomal dominant polycystic kidney disease. N Engl J Med. 1993;329:332–342. - PubMed
    1. Torra R, Nicolau C, Badenas C, Navarro S, Perez L, Estivill X, Darnell A. Ultrasonographic study of pancreatic cysts in autosomal dominant polycystic kidney disease. Clin Nephrol. 1997;47:19–22. - PubMed
    1. The European Polycystic Kidney Disease Consortium The polycystic kidney disease 1 gene encodes a 14 kb transcript and lies within a duplicated region on chromosome 16. Cell. 1994;77:881–894. - PubMed
    1. The International Polycystic Kidney Disease Consortium Polycystic kidney disease: The complete structure of the PKD1 gene and its protein. Cell. 1995;81:289–298. - PubMed
    1. Burn TC, Connors TD, Dackowski WR, Petry LR, Van Raay TJ, Millholland JM, Venet M, Miller G, Hakim RM, Landes GM, Klinger KK, Qian F, Onuchic LF, Watnick T, Germino GG, Doggett NA. Analysis of the genomic sequence for the autosomal dominant polycystic kidney disease (PKD1) gene predicts the presence of a leucine-rich repeat. The American PKD1 Consortium. Hum Mol Genet. 1995;4:575–582. - PubMed

Publication types

MeSH terms

Substances