. 2006 Feb 1;20(3):282-96.
doi: 10.1101/gad.1383206.

Selective and antagonistic functions of SWI/SNF and Mi-2beta nucleosome remodeling complexes during an inflammatory response

Affiliations

Selective and antagonistic functions of SWI/SNF and Mi-2beta nucleosome remodeling complexes during an inflammatory response

Vladimir R Ramirez-Carrozzi et al. Genes Dev. .

Abstract

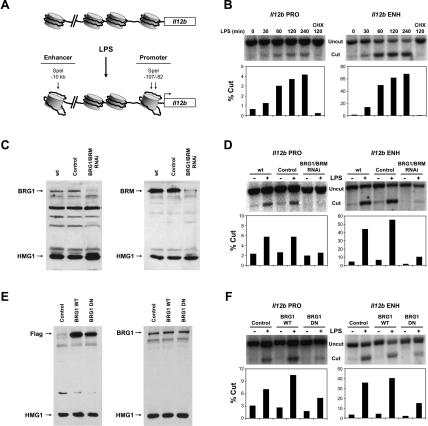
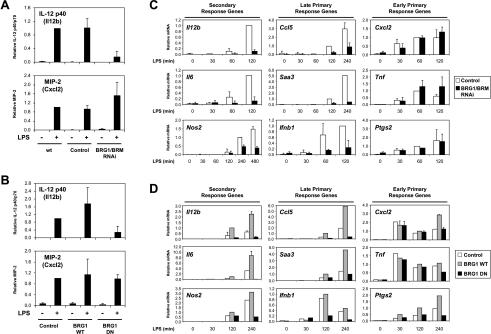
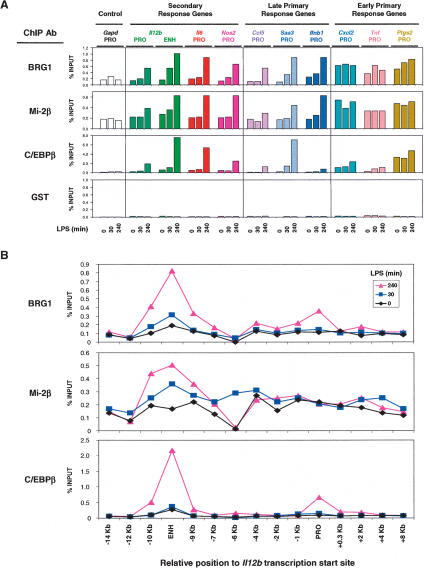
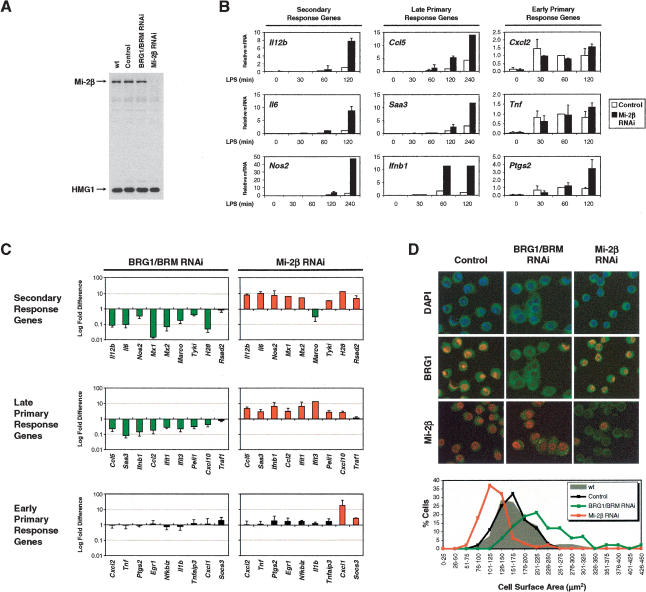
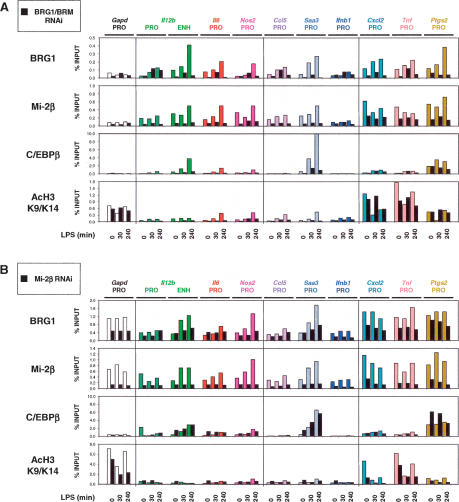
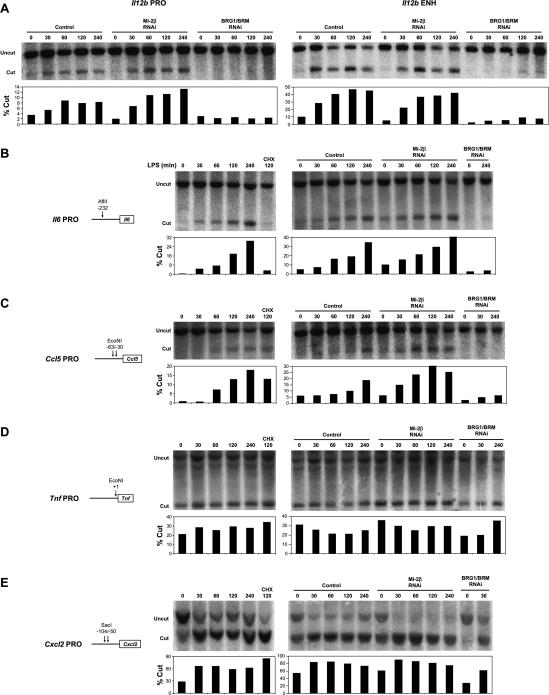
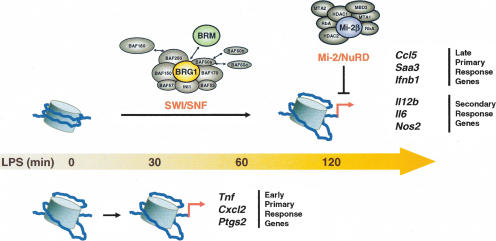
Studies of mammalian genes activated in response to an acute stimulus have suggested diverse mechanisms through which chromatin structure and nucleosome remodeling events contribute to inducible gene transcription. However, because of this diversity, the logical organization of the genome with respect to nucleosome remodeling and gene induction has remained obscure. Numerous proinflammatory genes are rapidly induced in macrophages in response to microbial infection. Here, we show that in lipopolysaccharide-stimulated macrophages, the catalytic BRG1/BRM subunits of the SWI/SNF class of ATP-dependent nucleosome remodeling complexes are consistently required for the activation of secondary response genes and primary response genes induced with delayed kinetics, but not for rapidly induced primary response genes. Surprisingly, a Mi-2beta complex was selectively recruited along with the SWI/SNF complexes to the control regions of secondary response and delayed primary response genes, with the Mi-2beta complex acting antagonistically to limit the induction of these gene classes. SWI/SNF and Mi-2beta complexes influenced cell size in a similarly antagonistic manner. These results provide insight into the differential contributions of nucleosome remodeling complexes to the rapid induction of defined classes of mammalian genes and reveal a robust anti-inflammatory function of Mi-2beta.


Figures

Figure 1.
Figure 1.
SWI/SNF-dependent nucleosome remodeling at Il12b control regions. (A) The locations of SpeI restriction enzyme recognition sites used for the analysis of LPS-induced nucleosome remodeling at the Il12b promoter and enhancer are shown. (B) Nuclei from J774 macrophages stimulated with LPS for the indicated times were digested with SpeI for 15 min (Cut). The purified DNA was then digested with two reference enzymes (Uncut) and analyzed by Southern blot using promoter-specific (PRO) and enhancer-specific (ENH) 32P-labeled probes as described (Weinmann et al. 1999; Zhou et al. 2004). Nuclei from J774 cells pretreated with cycloheximide (CHX) for 15 min before LPS activation were also analyzed. The efficiency of SpeI cleavage was quantified by PhosphorImager analysis and plotted as the percentage of genomic DNA cleaved by SpeI (% Cut). The data are representative of three independent experiments. (C) BRG1 and BRM were simultaneously depleted in J774 macrophages using a retroviral RNAi strategy. The siRNA hairpin was designed to target a homologous sequence of the BRG1 and BRM mRNAs. The expression of BRG1 (left) and BRM (right) was monitored by Western blot in whole-cell extracts prepared from uninfected J774 macrophages (wt) or from J774 cells infected with an empty RNAi retroviral vector (control) or the BRG1/BRM RNAi vector. The DNA-binding protein HMG1 was analyzed as a loading control. (D) The restriction enzyme accessibility assay was used to monitor nucleosome remodeling at the Il12b promoter (PRO) and enhancer (ENH) in nuclei from uninfected cells (wt), empty vector (control) cells, and BRG1/BRM-depleted cells before (-) or after (+) LPS stimulation for 4 h. (E) Wild-type (WT) and dominant-negative (DN) BRG1 proteins were stably expressed in J774 macrophages. Expression of BRG1 WT and BRG1 DN was monitored by Western blot using Flag (left) and BRG1 (right) antibodies and whole-cell extracts from uninfected J774 cells (control) or J774 cell clones expressing Flag-tagged dominant-negative BRG1 or wild-type BRG1. (F) Restriction enzyme accessibility assays were performed with nuclei from uninfected J774 cells or cell clones expressing BRG1 WT or BRG1 DN, before (-) and after (+) LPS stimulation for 4 h.
Figure 2.
Figure 2.
Selective requirement for SWI/SNF at secondary response and late primary response genes. (A) IL-12 p40 (Il12b) and MIP-2 (Cxcl2) production were monitored by ELISA in supernatants from uninfected J774 cells (wt), cells infected with the empty retroviral vector (control), and BRG1/BRM-depleted cells, before (-) and after (+) LPS stimulation for 4 h. The amounts of secreted protein are plotted relative to uninfected J774 cells and include data from three independent experiments. (B) IL-12 p40 and MIP-2 production were monitored by ELISA in supernatants from uninfected J774 cells (control) or J774 clones expressing wild-type (BRG1 WT) or dominant-negative (BRG1 DN) BRG1 before (-) and after (+) LPS stimulation for 4 h. Data were quantified as in A. (C) Quantitative real-time RT–PCR was used to analyze RNA harvested from J774 cells infected with the empty retroviral vector (white bars) or BRG1/BRM RNAi-depleted (black bars) cells stimulated with LPS for the indicated times. Nine potent LPS-induced genes were grouped according to their sensitivity to CHX (primary vs. secondary response genes) and kinetics of induction (early vs. late). For each gene examined, mRNA levels were normalized to the constitutive Gapd mRNA. The mRNA levels were plotted relative to time points at which significant signals were obtained. This approach was necessary because fold inductions would otherwise be weighted relative to weak background signals obtained in the absence of LPS. For secondary and late primary response genes, mRNA levels were plotted relative to the level observed at 120 min of LPS stimulation in control cells, with the exception of Nos2, which was plotted relative to the 240-min time point. For early primary response genes, mRNA levels were plotted relative to the 60-min time point from control cells. The relative mRNA values were determined from three to five independent BRG1/BRM RNAi depletion experiments. (D) Quantitative real-time RT–PCR was used to analyze mRNA levels in uninfected J774 cells (white bars), BRG1 WT cells (gray bars), and BRG1 DN cells (black bars) stimulated with LPS for the indicated time points. mRNA levels were plotted relative to the 120-min time point from BRG1 WT cells.
Figure 3.
Figure 3.
Association of BRG1 and Mi-2β with proinflammatory control regions. (A) A ChIP assay was employed using antibodies directed against BRG1, Mi-2β, C/EBPβ, and GST. Sheared, cross-linked chromatin was prepared from J774 cells treated with LPS for 0, 30, or 240 min. Precipitated DNA was quantified by real-time PCR using primers specific for the indicated control regions. The relative abundance of each control region was plotted relative to input DNA (% INPUT). The data are representative of experiments from three independent chromatin preparations. (B) ChIP analysis at the Il12b locus using chromatin prepared from J774 cells treated with LPS for 0, 30, and 240 min and precipitated with antibodies directed against BRG1, Mi-2β, and C/EBPβ. Precipitated DNA samples were amplified using primer pairs specific to the indicated regions relative to the Il12b transcriptional start site.
Figure 4.
Figure 4.
Antagonistic functions of SWI/SNF and Mi-2β complexes. (A) Mi-2β was depleted from J774 cells using the retroviral RNAi strategy. Mi-2β expression was monitored by Western blot in whole-cell extracts prepared from uninfected J774 cells (wt), cells infected with the empty RNAi vector (control), or cells infected with RNAi vectors that target BRG1/BRM or Mi-2β. HMG1 expression was analyzed as a loading control. (B) The effect of Mi-2β depletion on gene expression was monitored by real-time RT–PCR, using RNA harvested from J774 cells infected with the empty retroviral vector (white bars) or Mi-2β-depleted (black bars) cells stimulated with LPS for the indicated time points. Relative mRNA values were calculated as in Figure 2C. (C) mRNA levels (fold differences in log scale) were compared between BRG1/BRM-depleted cells and cells infected with the empty retroviral vector (left column), or between Mi-2β-depleted cells and cells infected with the empty vector (right column). For each gene, the time-dependent induction in mRNA levels in response to LPS stimulation was measured by quantitative real-time RT–PCR. The effects on mRNA levels due to BRG1/BRM or Mi-2β depletion were pooled from different time points after LPS stimulation whenever the induction was at least fivefold in the control cells. Differences in mRNA levels greater than twofold are represented as green bars (decrease) or red bars (increase), whereas differences less than twofold are represented as black bars. (D) Confocal fluorescence microscopy was used to analyze J774 macrophages infected with the empty RNAi vector (control), as well as the BRG1/BRM and Mi-2β RNAi vectors, all of which express GFP (green). Cells were stained with DAPI (blue) and analyzed for protein depletion using BRG1 or Mi-2β antibodies (red). Digital images were used to measure cell surface area. The graph shows the distribution of surface area of uninfected cells (n = 83, gray area), empty vector-infected cells (n = 114, black plot), BRG1/BRM-depleted cells (n = 126, green plot), and Mi-2β-depleted cells (n = 111, red plot).
Figure 5.
Figure 5.
ChIP analyses in BRG1/BRM- and Mi-2β-depleted cells (A) ChIP experiments were performed side-by-side with chromatin prepared from cells infected with the empty RNAi vector (color bars) and from BRG1/BRM-depleted cells (black bars) treated with LPS for 0, 30, and 240 min. Antibodies directed against BRG1, Mi-2β, C/EBPβ, and histone H3 acetylated at Lys 9 and Lys 14 (Ac-H3 K9/K14) were used. Precipitated DNA was quantified and plotted as in Figure 3A. (B) Parallel ChIP experiments with chromatin prepared from cells infected with the empty RNAi vector (color bars) and from Mi-2β-depleted cells (black bars) treated with LPS for 0, 30, and 240 min.
Figure 6.
Figure 6.
Restriction enzyme accessibility analysis of proinflammatory control regions. The restriction enzyme accessibility assay was used to monitor LPS-induced nucleosome remodeling at the Il12b promoter and enhancer (A), and at the promoter regions of the proinflammatory genes Il6 (B), Ccl5 (C), Tnf (D), and Cxcl2 (E). Uninfected J774 cells, empty vector (control) cells, Mi-2β-depleted cells, and BRG1/BRM-depleted cells were treated with LPS for the indicated times and pretreated with CHX where indicated. Isolated nuclei were digested with the restriction enzymes indicated in the figures, and the cleaved DNAs were analyzed by Southern blot as described in the legend for Figure 1.
Figure 7.
Figure 7.
Differential contributions of nucleosome remodeling complexes during inflammatory gene induction. A summary of the results depicts the selective requirement for SWI/SNF complexes at secondary response and late primary response genes, with Mi-2β negatively influencing these same sets of genes. Early primary response genes do not appear to be regulated by either SWI/SNF or Mi-2β complexes.

References

    1. Agalioti T., Lomvardas, S., Parekh, B., Yie, J., Maniatis, T., and Thanos, D. 2000. Ordered recruitment of chromatin modifying and general transcription factors to the IFN-β promoter. Cell 103: 667-678. - PubMed
    1. Akira S., Takeda, K., and Kaisho, T. 2001. Toll-like receptors: Critical proteins linking innate and acquired immunity. Nat. Immunol. 2: 675-680. - PubMed
    1. Armstrong J.A., Papoulas, O., Daubresse, G., Sperling, A.S., Lis, J.T., Scott, M.P., and Tamkum, J.W. 2002. The Drosophila BRM complex facilitates global transcription by RNA polymerase II. EMBO J. 21: 5245-5254. - PMC - PubMed
    1. Barton G.M. and Medzhitov, R. 2002. Retroviral delivery of small interfering RNA into primary cells. Proc. Natl. Acad. Sci. 99: 14943-14945. - PMC - PubMed
    1. Becker P.B. and Horz, W. 2002. ATP-dependent nucleosome remodeling. Annu. Rev. Biochem. 71: 247-273. - PubMed

Publication types

MeSH terms