. 2006 Feb 1;26(5):1562-70.
doi: 10.1523/JNEUROSCI.4142-05.2006.

Hippocampal CA3 NMDA receptors are crucial for adaptive timing of trace eyeblink conditioned response

Affiliations

Hippocampal CA3 NMDA receptors are crucial for adaptive timing of trace eyeblink conditioned response

Yasushi Kishimoto et al. J Neurosci. .

Abstract

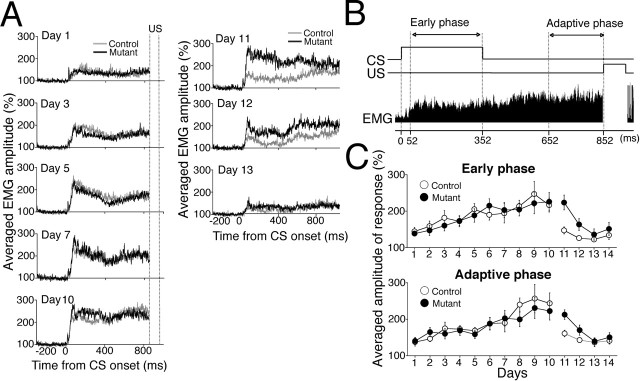
Classical conditioning of the eyeblink reflex is a simple form of associative learning for motor responses. To examine the involvement of hippocampal CA3 NMDA receptors (NRs) in nonspatial associative memory, mice lacking an NR1 subunit selectively in adult CA3 pyramidal cells [CA3-NR1 knock-out (KO) mice] were subjected to eyeblink conditioning paradigms. Mice received paired presentations of an auditory conditioned stimulus (CS) and a periorbital shock unconditioned stimulus (US). With repeated presentation of the CS followed by the US, wild-type mice learned to blink in anticipation of the US before its onset. We first confirmed that wild-type mice require an intact hippocampus in the trace version of eyeblink conditioning in which the CS and US do not overlap, creating a stimulus-free time gap of 500 ms. Under the same condition, CA3-NR1 KO mice successfully acquired conditioned responses (CRs) during the 10 d acquisition sessions, whereas the extinction of CRs was impaired on the first day of extinction sessions. Importantly, CA3-NR1 KO mice were impaired in the formation of an adaptively timed CR during the first five trials in the daily acquisition sessions. The aberrantly timed CR was also observed in the extinction sessions in accordance with the impaired extinction of CRs. These results indicate that CA3-NR1 KO mice are unable to rapidly retrieve adaptive CR timing, suggesting that CA3 NRs play a crucial role in the memory of adaptive CR timing in trace conditioning.


Figures

Figure 1.
Figure 1.
Effect of bilateral hippocampal lesion on delay and trace eyeblink conditioning in C57BL/6 mice. A, Representative coronal sections showing the hippocampal formation in ibotenate-injected wild-type mice. Nissl-stained coronal sections of dorsal (anterior) and ventral (posterior) hippocampus are shown from SH (left) and HIP (right) mice. Scale bar, 500 μm. B, C, Delay eyeblink conditioning in both SH and HIP mice. B, Percentages of conditioned response (CR%) were increased in both SH (open circles; n = 8) and HIP (closed circles; n = 8) mice. Temporal relationship between CS and US is depicted in the top panel. C, The graph shows averaged EMG amplitude of an eyeblink response for SH (gray trace) and HIP (black trace) mice on day 7, indicating no difference in the two groups. D, E, Trace eyeblink conditioning in both SH and HIP mice. D, Percentage of adaptive CR for the 500 ms trace-interval eyeblink conditioning was increased in SH (open circles; n = 8) but not in HIP (closed circles; n = 8) mice. Temporal relationship between the CS and US is shown in the top panel. E, Average EMG amplitude on day 10 of the SH mice (gray trace) showed adaptive CRs in a biphasic conditioned response. In contrast, HIP mice (black trace) showed almost no adaptive CRs, whereas diminished short-latency CRs still remained.
Figure 2.
Figure 2.
Normal acquisition and impaired extinction of adaptive CRs during trace conditioning in CA3-NR1 KO mice. A, Trace conditioning experiment consisted of an acquisition phase (days 1–10) followed by an extinction phase (days 11–14). In the acquisition phase, there was no difference in the percentage of adaptive CRs evaluated daily, which were elicited within 200 ms of the US onset during trace conditioning between floxed-NR1 (control; open circles; n = 11) and CA3-NR1 KO (mutant; closed circles; n = 12) mice. In contrast, the mutant CR (%) was significantly higher than that of controls in the extinction phase. Temporal relationships between CS and US are imposed in the top panel. sp, Spontaneous eyeblink response. The arrowhead indicates significant difference between the control and mutant mice. B, EMG response topographies of individual mice averaged by each 10-trial block on day 10 (last session of acquisition phase) and day 11 (first session of extinction phase). On day 10, no difference was observed between the control (left) and mutant (right) mice. However, on day 11, the response amplitudes of the mutant mice were significantly larger than those of the controls (Fig. 3B, day 11).
Figure 3.
Figure 3.
Impaired adaptive CR during extinction of trace conditioning in CA3-NR1 KO mice. A, Left, Response EMGs for both the control (gray traces) and the mutant (black traces) mice were averaged daily on days 1, 3, 5, 7, and 10 during acquisition phase in trace conditioning, and there were no differences in any of the days between the two genotypes. Right, During extinction phase, significantly higher response amplitudes of average EMG were observed in mutants than in controls on days 11 and 12 but not on day 13. B, An example of response EMG from control mice in a CS–US paired trial is presented. Averaged amplitudes of EMG were evaluated by the two distinct phases. Early phase was defined as a period when a CS tone is applied except for the first 52 ms. Adaptive phase was a period of 200 ms before the US. C, Averaged amplitudes of response EMGs during the early (top) and adaptive (bottom) phases are calculated throughout the entire acquisition and extinction sessions. The mutants showed higher levels of EMG amplitudes in both early and adaptive phases on day 11, suggesting extinction of both adaptive and nonadaptive CR was retarded in CA3-NR1 KO mice.
Figure 4.
Figure 4.
Frequency of adaptive CR was impaired within the first 10 trials of acquisition in CA3-NR1 KO mice. A, An example of typical CR from control mice in a CS–US paired trial is presented. Frequency of CR (%) was evaluated by the two distinct time windows. Adaptive CR was judged by the response EMG data for the last 200 ms before the US. Early CR was evaluated by a period when a CS tone is applied except for the first 52 ms. B, Left, Early CRs (% frequency) of both control (open circles) and mutant (closed circles) mice were evaluated in the first 10 trials (1–10th trials; top), the second 10 trials (11–20th trials; middle), and the final 10 trials (91–100th trials; bottom) of daily session during trace conditioning. There was no difference in any blocks between two genotypes, whereas the mutant CR (%) was higher in the last 10-trial block on day 11. Right, Adaptive CR (% frequency) was averaged every 10-trial block in both groups. The mutant CR (%) in the first 10 trials from days 8 to 10 was significantly higher than that of controls. The higher mutant CR (%) was also observed in the last 10 trials on day 11 during extinction. C, Comparison of adaptive CRs (%) between the last 10 trials (91–100th trials) of a session and the first 10 trials (trials 1–10) of the session on the following day during the last 4 days of acquisition phase. There was no significant change of adaptive CR (%) in the control mice from the last 10 trials on days 7, 8, and 9 to the first 10 trials on days 8, 9, and 10, respectively. In contrast, the mutants exhibited significant reduction in adaptive CR (%) from the last 10 trials on days 8 and 9 to the first 10 trials on days 9 and 10, respectively. D, Adaptive CRs (% frequency) of two genotype animals on days 8, 9, and 10 during trace conditioning were averaged on each trial (trials 1–20). In the first three trials, the level of mutant CRs was nearly the same as that observed on day 1. However, it was restored until the sixth trial, and no difference was observed hereafter between two groups. E, Adaptive CRs (%) on the first day of extinction (day 11) were averaged on every trial (trials 1–20 and 91–100) for each genotype. Control mice exhibited a gradual decrease in CR (%) throughout the 100-trials session, demonstrating the normal extinction curve. In contrast, CR (%) in the mutant mice did not change within the session. As a result, a significant amount of adaptive CR memory remained in the last 10 trials. pre, Averaged frequency of eyeblink response before the training for acquisition (background).
Figure 5.
Figure 5.
Impaired elevation of adaptive EMG amplitude in the first 10 trials of acquisition in CA3-NR1 KO mice. A, Response EMG (amplitude %) of both control (gray traces) and mutant (black traces) mice is shown with the first 10 trials (1–10th trials; top), the second 10 trials (11–20th trials; middle), and the final 10 trials (91–100th trials; bottom) of the daily session on days 6 and 10 (acquisition phase) and on day 11 (extinction phase) of trace conditioning. The adaptive CR amplitude in the first 10 trials on day 10 of the mutants was significantly lower than that of controls. The higher short-latency CR amplitude was also observed in trials 11–20 and the last 10 trials on day 11 in the mutant mice. B, Averaged amplitudes of response EMGs during the early (left) and adaptive (right) phases are presented with the first 10 trials (top), the 11–20th trials (middle), and the 91–100th trials (bottom) of daily sessions, respectively. Mutants failed to show an increase in the adaptive phase-EMG amplitudes to the level of controls in the first 10 trials from days 8 to 10. Arrowheads indicate significant difference in CR (%) between the control and mutant mice.
Figure 6.
Figure 6.
Normal delay conditioning in CA3-NR1 KO mice. A, Delay conditioning experiment consisted of 7 d acquisition (days 1–7) followed by 4 d extinction (days 8–11). There was no difference in eyeblink CR (% frequency) in the control (open circles; n = 11) and mutant (closed circles; n = 12) mice during both acquisition and extinction phases. The top panel shows response topographies of individual mice averaged by 100 trials on day 7. Temporal relationships between CS and US are indicated. sp, Spontaneous eyeblink response. B, No difference was observed in response EMGs for the control (gray trace) and mutant (black trace) mice on day 7. C, CRs (% frequency) of both control (open circles) and mutant (closed circles) mice were evaluated in the first 10 trials (1–10th trials; top), the second 10 trials (11–20th trials; middle), and the final 10 trials (91–100th trials; bottom) of the daily session. No difference was observed between the two genotypes.

Similar articles

Cited by

References

    1. Abbott LF, Blum KI (1996). Functional significance of long-term potentiation for sequence learning and prediction. Cereb Cortex 6:406–416. - PubMed
    1. August DA, Levy WB (1999). Temporal sequence compression by an integrate-and-fire model of hippocampal area CA3. J Comput Neurosci 6:71–90. - PubMed
    1. Bao S, Chen L, Qiao X, Knusel B, Thompson RF (1998). Impaired eye-blink conditioning in waggler, a mutant mouse with cerebellar BDNF deficiency. Learn Mem 5:355–364. - PMC - PubMed
    1. Chan KH, Morell JR, Jarrard LE, Davidson TL (2001). Reconsideration of the role of the hippocampus in learned inhibition. Behav Brain Res 119:111–130. - PubMed
    1. Cho YH, Friedman E, Silva AJ (1999). Ibotanate lesions of the hippocampus impair spatial learning but not contextual fear conditioning in mice. Behav Brain Res 98:77–87. - PubMed

Publication types

Substances