. 2006 Feb;116(2):344-56.
doi: 10.1172/JCI26295.

GDNF rescues hyperglycemia-induced diabetic enteric neuropathy through activation of the PI3K/Akt pathway

Affiliations

GDNF rescues hyperglycemia-induced diabetic enteric neuropathy through activation of the PI3K/Akt pathway

Mallappa Anitha et al. J Clin Invest. 2006 Feb.

Abstract

Diabetes can result in loss of enteric neurons and subsequent gastrointestinal complications. The mechanism of enteric neuronal loss in diabetes is not known. We examined the effects of hyperglycemia on enteric neuronal survival and the effects of glial cell line-derived neurotrophic factor (GDNF) on modulating this survival. Exposure of primary enteric neurons to 20 mM glucose (hyperglycemia) for 24 hours resulted in a significant increase in apoptosis compared with 5 mM glucose (normoglycemia). Exposure to 20 mM glucose resulted in decreased Akt phosphorylation and enhanced nuclear translocation of forkhead box O3a (FOXO3a). Treatment of enteric neurons with GDNF ameliorated these changes. In streptozotocin-induced diabetic mice, there was evidence of myenteric neuronal apoptosis and reduced Akt phosphorylation. Diabetic mice had loss of NADPH diaphorase-stained myenteric neurons, delayed gastric emptying, and increased intestinal transit time. The pathophysiological effects of hyperglycemia (apoptosis, reduced Akt phosphorylation, loss of inhibitory neurons, motility changes) were reversed in diabetic glial fibrillary acidic protein-GDNF (GFAP-GDNF) Tg mice. In conclusion, we demonstrate that hyperglycemia induces neuronal loss through a reduction in Akt-mediated survival signaling and that these effects are reversed by GDNF. GDNF may be a potential therapeutic target for the gastrointestinal motility disorders related to diabetes.


Figures

Figure 1
Figure 1
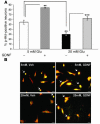
Hyperglycemia induces apoptosis in enteric neurons, and this is ameliorated by GDNF. To study the dose-dependent effects of hyperglycemia, different concentrations of glucose (5, 10, or 20 mM) were used in serum-free/glucose-free media. (A) Apoptosis was assessed by the Ret/Hoechst staining method. (B) Magnified view of neurons to show the DNA fragmentation (arrow) seen during apoptosis compared with a healthy neuron (on the right). (C) Apoptosis was assessed using the Ret/TUNEL method in the presence or absence of GDNF and the stated glucose or mannitol concentrations. (D) Representative photomicrographs of enteric neurons cultured in the presence of 5 mM and 20 mM glucose and assessed for apoptosis using the Ret/TUNEL method. Ret (red) staining was used as a neuronal marker. Arrows identify the apoptotic cells (yellow) with condensed nuclei. Figure shows results of 4 independent experiments. *P < 0.05; **P < 0.01; ***P < 0.001. Scale bars: 20 μm (B); 100 μm (D). Glu, glucose.
Figure 2
Figure 2
Hyperglycemia is associated with decreased Akt phosphorylation. Enteric neurons were cultured in medium containing 5 or 20 mM glucose in the presence or absence of GDNF. Cells were cultured for 24 hours, fixed, and stained using a primary antibody to p-Akt. Peripherin staining was performed as a counterstain to identify neurons. (A) Percentage of p-Akt+/peripherin+ neurons under different culture conditions. Results are from 4 independent experiments. (B) Representative photographs of p-Akt staining under different culture conditions. Arrows indicate p-Akt–stained neurons. **P < 0.01; ***P < 0.001. Scale bars: 20 μm.
Figure 3
Figure 3
Hyperglycemia is associated with increased FOXO3a translocation. Enteric neurons were cultured in medium containing 5 or 20 mM glucose in the presence or absence of GDNF. Cells were cultured for 24 hours, fixed, and stained for FOXO3a and the neuronal marker peripherin. (A) The percentage of neurons with nuclear translocation of FOXO3a under the different culture conditions is shown. (B) Representative photographs of FOXO3a/peripherin staining. Arrows represent neurons with nuclear translocation of FOXO3a. Results are from 4 independent experiments. *P < 0.05; ***P < 0.001. Scale bars: 20 μm.
Figure 4
Figure 4
Expression of CA-Akt rescues hyperglycemia-induced ENS apoptosis. Enteric neurons were transfected with control p-EGFP construct or a CA-Akt construct with p-EGFP, cultured in the presence of 5 mM or 20 mM glucose for 24 hours, and assessed for apoptosis using the Ret/TUNEL method. (A) Overexpression of Akt rescued the enteric neurons from undergoing apoptosis. (B) Representative photographs under different culture conditions. The red staining represents Ret, and apoptotic cells (arrows) are identified by the yellow condensed nuclei. Results are from 3 independent experiments. **P < 0.01; ***P < 0.001. Scale bars: 100 μm.
Figure 5
Figure 5
Diabetes is associated with electron microscopic evidence of myenteric neuronal apoptosis. Myenteric neurons from the proximal colons of diabetic mice showed evidence of neuronal apoptosis with clumping of the chromatin, condensation of the nucleus (black arrow), mitochondrial ballooning and disruption of cristae (blue arrows), and disorganization of the neuropil. In contrast, control neurons displayed normal diffuse chromatin staining in the nucleus (green arrow), normal mitochondria (red arrows), and an organized neuropil.
Figure 6
Figure 6
Diabetes is associated with increased cleaved caspase-3 staining in myenteric neurons. (A) Transgene GDNF is expressed in the ilea in Tg-DM mice. Analysis of Tg GDNF mRNA expression in the ilea of WT-C and Tg-C mice by RT-PCR, using primers that detect the mRNA transcribed from the Tg construct. (B) GDNF staining in WT and Tg mouse ilea sections. The arrows point to the myenteric ganglia. The yellow staining is due to colocalization of GDNF and GFAP. GFAP was used as a glial marker. A total of 3 experiments was performed. Scale bars: 100 μm. (C) Frozen cross sections of WT-C, WT-DM, Tg-C, and Tg-DM mouse ilea were assessed for myenteric neuronal apoptosis. Apoptosis was assessed using double-labeling immunohistochemistry for cleaved caspase-3 (red) and peripherin (green). Representative photographs for WT-C and WT-DM mice are shown. The arrows point to the myenteric ganglia. Apoptosis in the ganglia is identified by yellow staining due to colocalization of cleaved caspase-3 and peripherin. (D) Magnified view of white box in C shows the yellow-stained caspases positive enteric ganglia. (E) Percentage increase in cleaved caspase-3–positive enteric ganglia in different mice compared with WT-C. A total of 3 experiments was performed. ***P < 0.001. Scale bars: 100 μm.
Figure 7
Figure 7
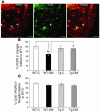
Diabetes is associated with decreased expression of PI3K in enteric neurons. Frozen cross sections of control (A) and STZ-induced diabetic mouse ilea (B) were assessed for myenteric neuronal p-Akt staining using an antibody specific for p-Akt (red). Arrows point to the myenteric ganglion stained with peripherin (green). The yellow staining represents p-Akt expression due to colocalization with peripherin. (C) The percentage of p-Akt–positive/peripherin-positive ganglia per section is shown. A total of 3 independent experiments was performed. (D) Representative Western blot of p-Akt and total Akt assessed in myenteric neurons isolated from the ilea of diabetic and control mice. (E) Ratio of p-Akt to Akt in myenteric neurons isolated from ilea of diabetic and control mice and assessed by Western blot analysis. A total of 3 independent experiments was performed. *P < 0.05; ***P < 0.001. Scale bars: 100 μm.
Figure 8
Figure 8
Diabetes is associated with loss of myenteric NADPH diaphorase–stained neurons, and this is rescued by GDNF. The myenteric plexuses and the longitudinal muscle layers from WT-C, WT-DM, Tg-C, and Tg-DM mice were separated from the rest of the intestines and used for staining. (A) Representative photographs of NADPH diaphorase–stained neurons. (B and C) Percentage change in the number of NADPH diaphorase–stained neurons (B) and large and small fibers (C) relative to WT-C. (D) Representative photographs of acetylcholine esterase–stained neurons. (E and F) Percentage change in the number of acetylcholine esterase–stained neurons (E) and large and small fibers (F) relative to WT-C. (G) Representative photograph of peripherin-stained neurons. (H) Percentage change in the number of peripherin-stained neurons relative to WT-C. As described in Methods, the number of neurons represents a sum of the neurons scored in 20 grids at ×40 magnification. *P < 0.05; **P < 0.01. Scale bars: 100 μM (A and D); 20 μm (G).
Figure 9
Figure 9
Assessment of PGP9.5 and ChAT-stained neurons in WT and Tg mice. (A) Representative photographs of cross sections of ilea from mice stained for PGP9.5 (red) and ChAT (green). (B and C) Percentage change in the number of ganglia staining positive for PGP9.5 (B) and ChAT/PGP9.5 (C) relative to WT-C is shown. A total of 3 independent experiments was performed. *P < 0.05; **P < 0.01. Scale bars: 100 μM.
Figure 10
Figure 10
Assessment of gastric emptying and intestinal transit. (A) Photograph of stomach and intestine from WT-C mouse 30 minutes after administration of methylene blue dye. Red arrow shows the maximum transit of methylene blue. (B) Gastric emptying was assessed 30 minutes after administration of methylene blue in WT-C, WT-DM, Tg-C, and Tg-DM mice, as described in Methods. (C) Intestinal transit was assessed 30 minutes after administration of methylene blue and expressed as a percentage of the total intestinal length, as described in Methods. n = 4 animals in each group. *P < 0.05; **P < 0.01.
Figure 11
Figure 11
Diabetes is associated with impaired colonic relaxation in response to inhibitory neuronal stimulation, and these changes are reversed in Tg-DM mice. EFS-induced relaxation of longitudinal muscle strips was assessed as described in Methods. Percentage relaxation was calculated by determining the difference between the maximal force generated at baseline and the minimum force following electrical stimulation and expressing this as a percentage of the force generated at baseline. (A) Transmural EFS–induced relaxation (100 V, 20 Hz, 5 milliseconds, 60 seconds) of the proximal colon was assessed in WT-C, WT-DM, Tg-C, and Tg-DM mice. n = 3 animals in each group. (B) Representative tracing of the recording of EFS-induced relaxation. The y axis represents force in mN, and the x axis represents time. The arrows represent when the electrical stimulation was turned on and off. *P < 0.05 versus all other groups.

Comment in

References

    1. Harris MI, et al. Prevalence of diabetes, impaired fasting glucose, and impaired glucose tolerance in U.S. adults. The Third National Health and Nutrition Examination Survey, 1988-1994. Diabetes Care. 1998;21:518–524. - PubMed
    1. Mokdad AH, et al. The continuing increase of diabetes in the US [letter] Diabetes Care. 2001;24:412. - PubMed
    1. Goyal RK, Spiro HM. Gastrointestinal manifestations of diabetes mellitus. Med. Clin. North Am. 1971;55:1031–1044. - PubMed
    1. Verne G, Sninsky CA. Diabetes and the gastrointestinal tract. Gastroenterol. Clin. North Am. 1998;27:861–874. - PubMed
    1. Schmidt RE, Plurad SB, Modert CW. Experimental diabetic autonomic neuropathy characterization in streptozotocin-diabetic Sprague-Dawley rats. Lab. Invest. 1983;49:538–552. - PubMed

Publication types

MeSH terms