. 2006 Feb;116(2):536-47.
doi: 10.1172/JCI26679.

Eotaxin-3 and a uniquely conserved gene-expression profile in eosinophilic esophagitis

Affiliations

Eotaxin-3 and a uniquely conserved gene-expression profile in eosinophilic esophagitis

Carine Blanchard et al. J Clin Invest. 2006 Feb.

Abstract

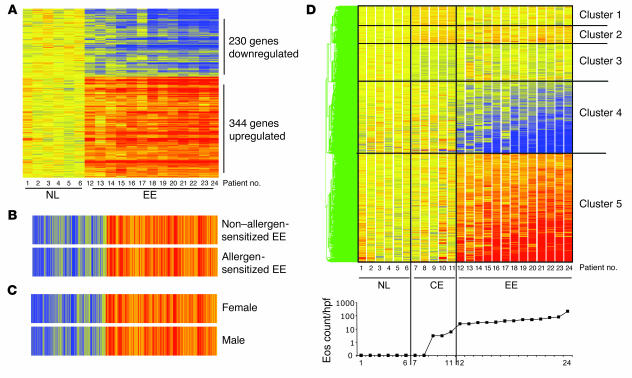
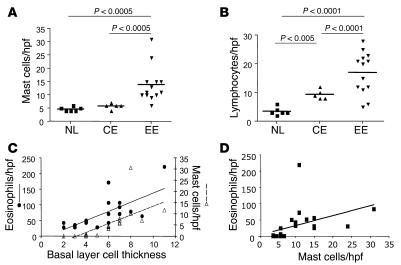
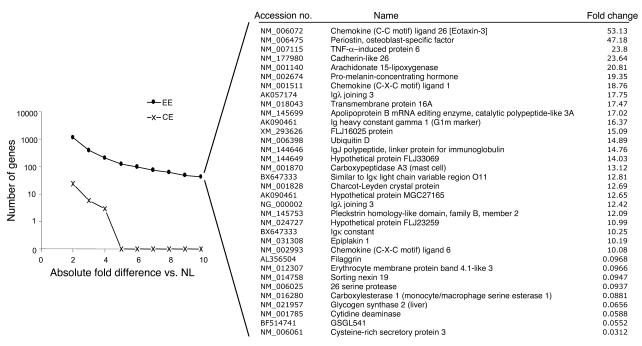
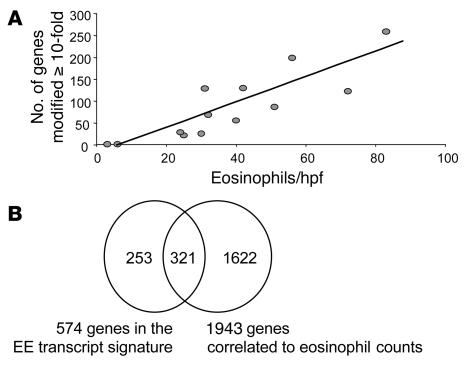
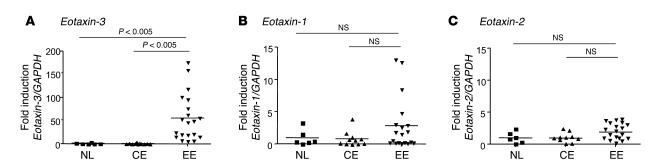
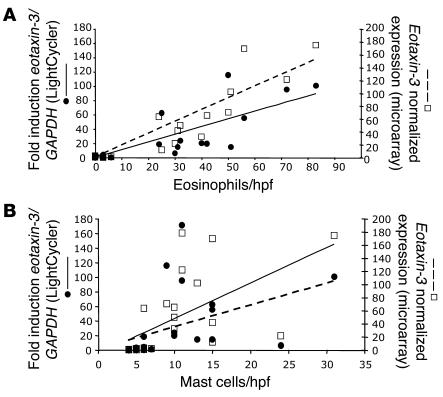
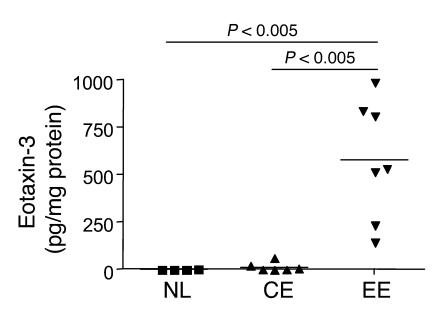
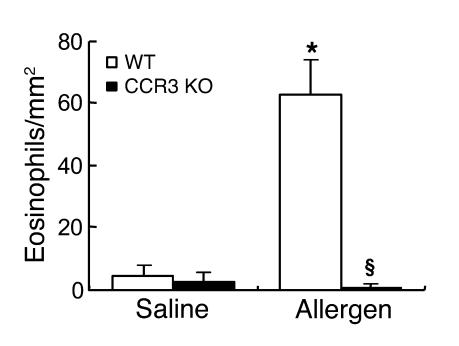
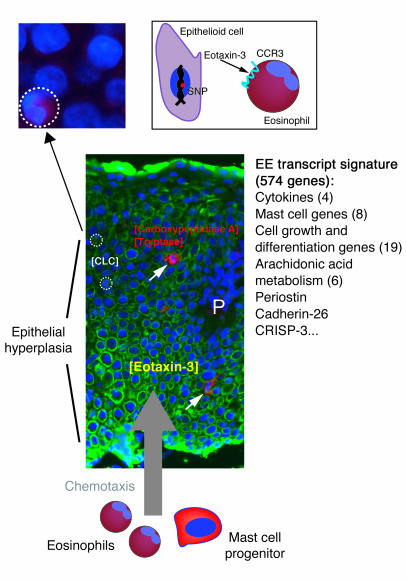
Eosinophilic esophagitis (EE) is an emerging disorder with a poorly understood pathogenesis. In order to define disease mechanisms, we took an empirical approach analyzing esophageal tissue by a genome-wide microarray expression analysis. EE patients had a striking transcript signature involving 1% of the human genome that was remarkably conserved across sex, age, and allergic status and was distinct from that associated with non-EE chronic esophagitis. Notably, the gene encoding the eosinophil-specific chemoattractant eotaxin-3 (also known as CCL26) was the most highly induced gene in EE patients compared with its expression level in healthy individuals. Esophageal eotaxin-3 mRNA and protein levels strongly correlated with tissue eosinophilia and mastocytosis. Furthermore, a single-nucleotide polymorphism in the human eotaxin-3 gene was associated with disease susceptibility. Finally, mice deficient in the eotaxin receptor (also known as CCR3) were protected from experimental EE. These results implicate eotaxin-3 as a critical effector molecule for EE and provide insight into disease pathogenesis.


Figures

Figure 1
Figure 1
Microarray analysis of the transcripts expressed in esophageal biopsies. RNA from each patient was subjected to chip analysis using Affymetrix Human Genome U133 Plus 2.0 GeneChips. The normal (NL) group is composed of 6 individuals (numbers 1–6), the CE group is represented by 5 patients (numbers 7–11), and 13 patients (numbers 12–24) are in the EE group, as reported in Supplemental Table 1. (A) The 574 genes differentially expressed (P < 0.01) in the EE group compared with normal healthy patients have been ordered (standard correlation); upregulated genes are represented in red and downregulated genes in blue. The magnitude of the gene changes is proportional to the darkness of the color. Each column represents a separate individual and each line a gene. (B and C) EE transcript signature is presented as a function of the allergic status and sex of EE patients. Average expression of the transcripts of the EE signature is depicted in the non–allergen-sensitized (n = 4) and allergen-sensitized EE patients (n = 9) (B) and in female (n = 5) and male EE patients (n = 8) (C). (D) The 574 genes expressed significantly differently (P < 0.01) in the EE group compared with normal healthy patients and the 228 genes expressed differently (P < 0.01) in the CE group compared with normal healthy patients have been analyzed by cluster analysis and ordered (distance) using GeneSpring software. Clusters 1, 2, and 3 highlight the CE transcripts, and clusters 4 and 5 highlight the EE transcripts. The eosinophil (Eos) count in each patient is shown in the lower panel.
Figure 2
Figure 2
Mast cell and lymphocyte counts in NL, CE, and EE patients. (A) The maximum mast cell count per hpf was assessed in patients 1–24 using immunohistochemistry. Biopsies were stained using monoclonal anti–human tryptase. (B) The maximum lymphocyte count per hpf was assessed in patients 1–24 on H&E staining. P values were calculated using the Welch T test (A and B). (C) The correlations between basal layer cell thickness and both maximum eosinophil level (r2 = 0.47, P < 0.0005) and mast cell level (r2 = 0.51, P < 0.0001) are shown. (D) The maximum eosinophil levels are presented as a function of maximum mast cell levels (r2 = 0.18, P < 0.05). P values were based on Pearson correlation (C and D).
Figure 3
Figure 3
Numbers of modified genes and their fold change in EE and CE. The average gene-expression levels in the EE and CE groups have been compared with that in the NL group. The number of genes that changed at least 10-fold is shown. The list of the 42 transcripts that were modified at least 10-fold in the EE compared with the NL group and their GenBank accession numbers is shown. The list includes 8 transcripts that were found twice in the EE transcriptome.
Figure 4
Figure 4
Correlation between eosinophil count and number of genes modified. (A) The number of genes expressed differently is presented as a function of the eosinophil count. The number of genes that changed at least 10-fold is plotted as a function of the maximum number of eosinophils in the biopsies (patients 1–23). A trendline (black line) has been inserted (r2 = 0.73, P < 0.05). (B) The overlap between the EE transcript signature (574 genes) and the 1,943 genes that most correlated (P ≤ 0.005) with the number of eosinophils is presented in a Venn diagram.
Figure 5
Figure 5
Eotaxin expression in EE patients. Quantitative analysis of eotaxin-1, -2, and -3 mRNA levels in NL, CE, and EE patients using real-time PCR analysis. The level of eotaxin-3 (A), eotaxin-1 (B), and eotaxin-2 (C) mRNA is shown. Each mRNA value is normalized to GAPDH mRNA and is expressed as fold change. The black line represents the mean value in each group. P values were calculated using the Welch T test. The number of subjects was 6, 11, and 19 for NL, CE, and EE, respectively.
Figure 6
Figure 6
Correlation between eotaxin-3 mRNA expression and esophageal eosinophil and mast cell counts. The eotaxin-3 expression was measured using LightCycler (filled circles and solid lines, r2 = 0.65, P < 0.0001, and r2 = 0.18, P < 0.05, in A and B, respectively) and microarray analysis (open squares and dashed lines, r2 = 0.84, P < 0.0001, and r2 = 0.36, P < 0.005, in A and B, respectively) and is plotted as a function of the maximum eosinophil (A) and mast cell counts (B) (cells per hpf) present in the biopsies of NL, CE, and EE patients.
Figure 7
Figure 7
Eotaxin-3 mRNA expression in biopsies of NL and EE esophagus. Esophageal sections (6 NL, 6 EE, and 3 CE) were subjected to in situ hybridization using an eotaxin-3 antisense probe (AF) and sense probe (G and H). The hybridization signal of the eotaxin-3 probe is shown in a representative biopsy from an NL patient representative of 6 NL biopsies (A and B) and from an EE patient representative of 6 EE biopsies (CH). Bright-field (A, C, and EG) and dark-field (B, D, and H) images were photographed at original magnifications of ×100 (AD, G, and H) and ×1,000 (E and F). Arrows indicate eotaxin-3 expression in epithelioid cells (signal grains appear bright in dark-field images and dark in bright-field images), and asterisks indicate representative eosinophils. Red signals in B, D, and H correspond to autofluorescence, especially of eosinophils.
Figure 8
Figure 8
Eotaxin-3 protein expression. The eotaxin-3 level was assessed by ELISA. Each data point represents the eotaxin-3 level in 1 individual. P values were calculated using the Welch T test.
Figure 9
Figure 9
Role of CCR3 in allergen-induced eosinophil recruitment to the esophagus of wild-type and CCR3-deficient (KO) mice. Mice were challenged with saline or allergen intranasally 3 times a week for 3 weeks. The esophagus was harvested 24 hours after the last intranasal treatment, and esophageal sections were stained with anti-MBP. Results represent the number of eosinophils (mean ± SD, n = 3) present in the esophagus per square millimeter. *P < 0.05 versus saline group, §P < 0.05 versus wild-type group.
Figure 10
Figure 10
Cellular and molecular mediators in EE. Microscopic assessment (lower panel; magnification, ×100) using a tryptase-specific antibody demonstrates scattered mast cells (bright-red-fluorescent cells marked by white arrows) among cytokeratin-positive epithelial cells (green-fluorescent cells, which are appropriately absent from the fibrovascular stroma within a papilla, marked “P”). Two eosinophils are designated by dashed circles. Eosinophils are identified by their characteristic red autofluorescence and nuclear morphology under higher magnification (e.g., lower left cell in top left panel; magnification, ×1000; green channel omitted). Nuclei are fluorescently counterstained (blue) with DAPI. We propose a model of EE pathogenesis involving eotaxin-3 expression by epithelioid cells. Eotaxin-3 overexpression promotes chemoattraction of CCR3-positive eosinophils and expression of the CLC protein. An SNP in the eotaxin-3 gene is associated with EE. Mast cells (white arrows) accumulate in the esophagus, and mast cell genes (tryptase-α and carboxypeptidase A3) are overrepresented in the EE transcript signature (Supplemental Table 5). Eotaxin-3 drives eosinophil activation that leads to tissue damage. CRISP-3, cysteine-rich secretory protein-3.

Comment in

Similar articles

Cited by

References

    1. Fox VL, Nurko S, Furuta GT. Eosinophilic esophagitis: it’s not just kid’s stuff. Gastrointest. Endosc. 2002;56:260–270. - PubMed
    1. Straumann A, et al. Natural history of primary eosinophilic esophagitis: a follow-up of 30 adult patients for up to 11.5 years. Gastroenterology. 2003;125:1660–1669. - PubMed
    1. Orenstein SR, et al. The spectrum of pediatric eosinophilic esophagitis beyond infancy: a clinical series of 30 children. Am. J. Gastroenterol. 2000;95:1422–1430. - PubMed
    1. Cheung KM, Oliver MR, Cameron DJ, Catto-Smith AG, Chow CW. Esophageal eosinophilia in children with dysphagia. J. Pediatr. Gastroenterol. Nutr. 2003;37:498–503. - PubMed
    1. Noel RJ, Putnam PE, Rothenberg ME. Eosinophilic esophagitis. N. Engl. J. Med. 2004;351:940–941. - PubMed

Publication types

MeSH terms