

Influence of primary-level and primary-frequency ratios on human distortion product otoacoustic emissions
- PMID: 16454296
- PMCID: PMC2440916
- DOI: 10.1121/1.2133714
Influence of primary-level and primary-frequency ratios on human distortion product otoacoustic emissions
Abstract
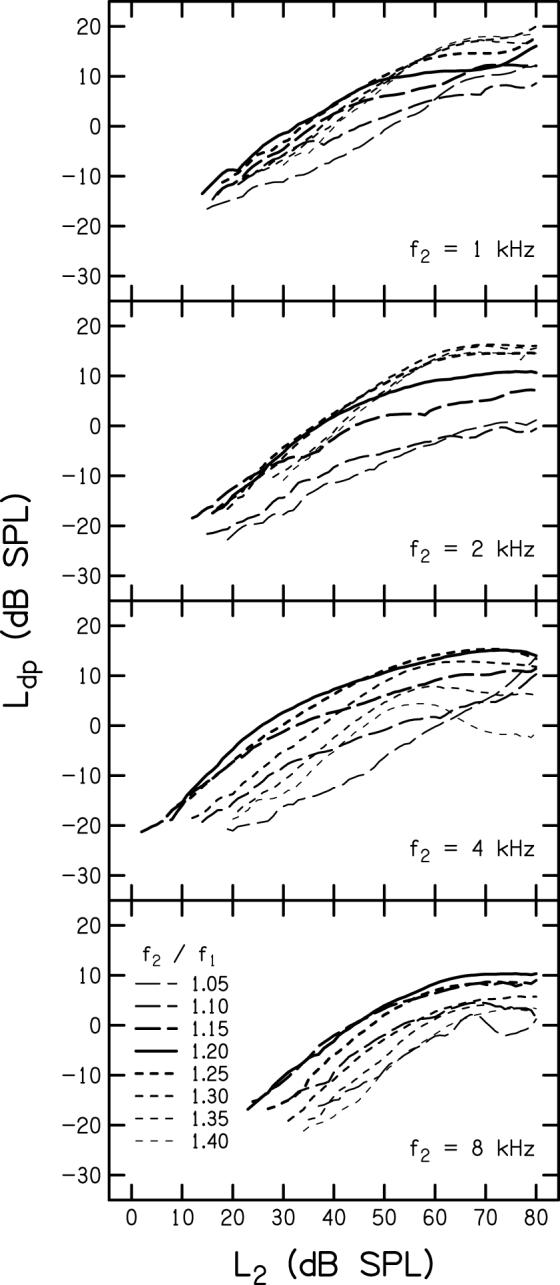
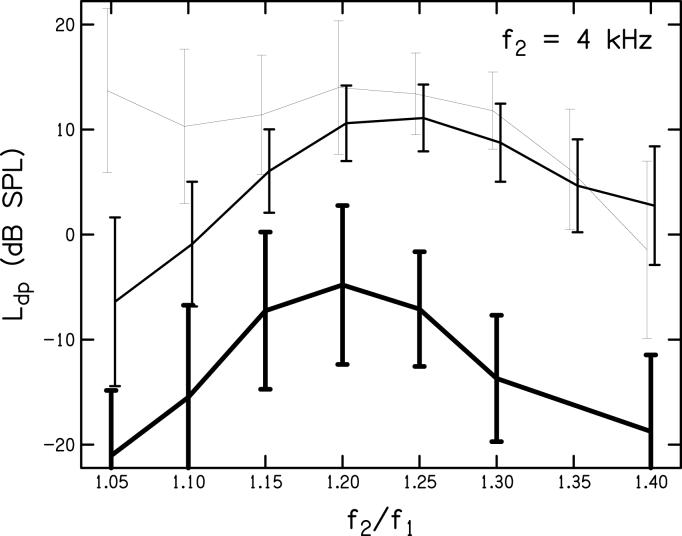
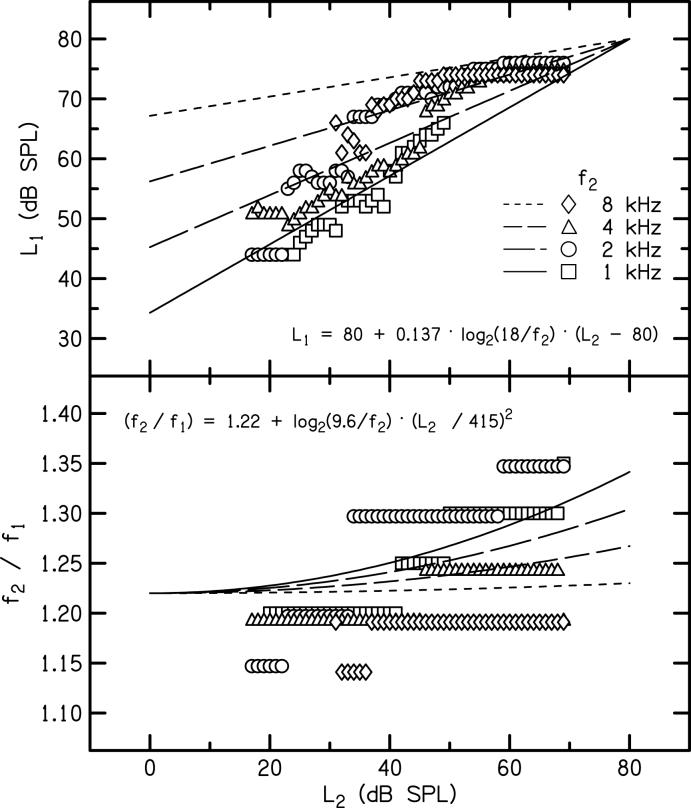
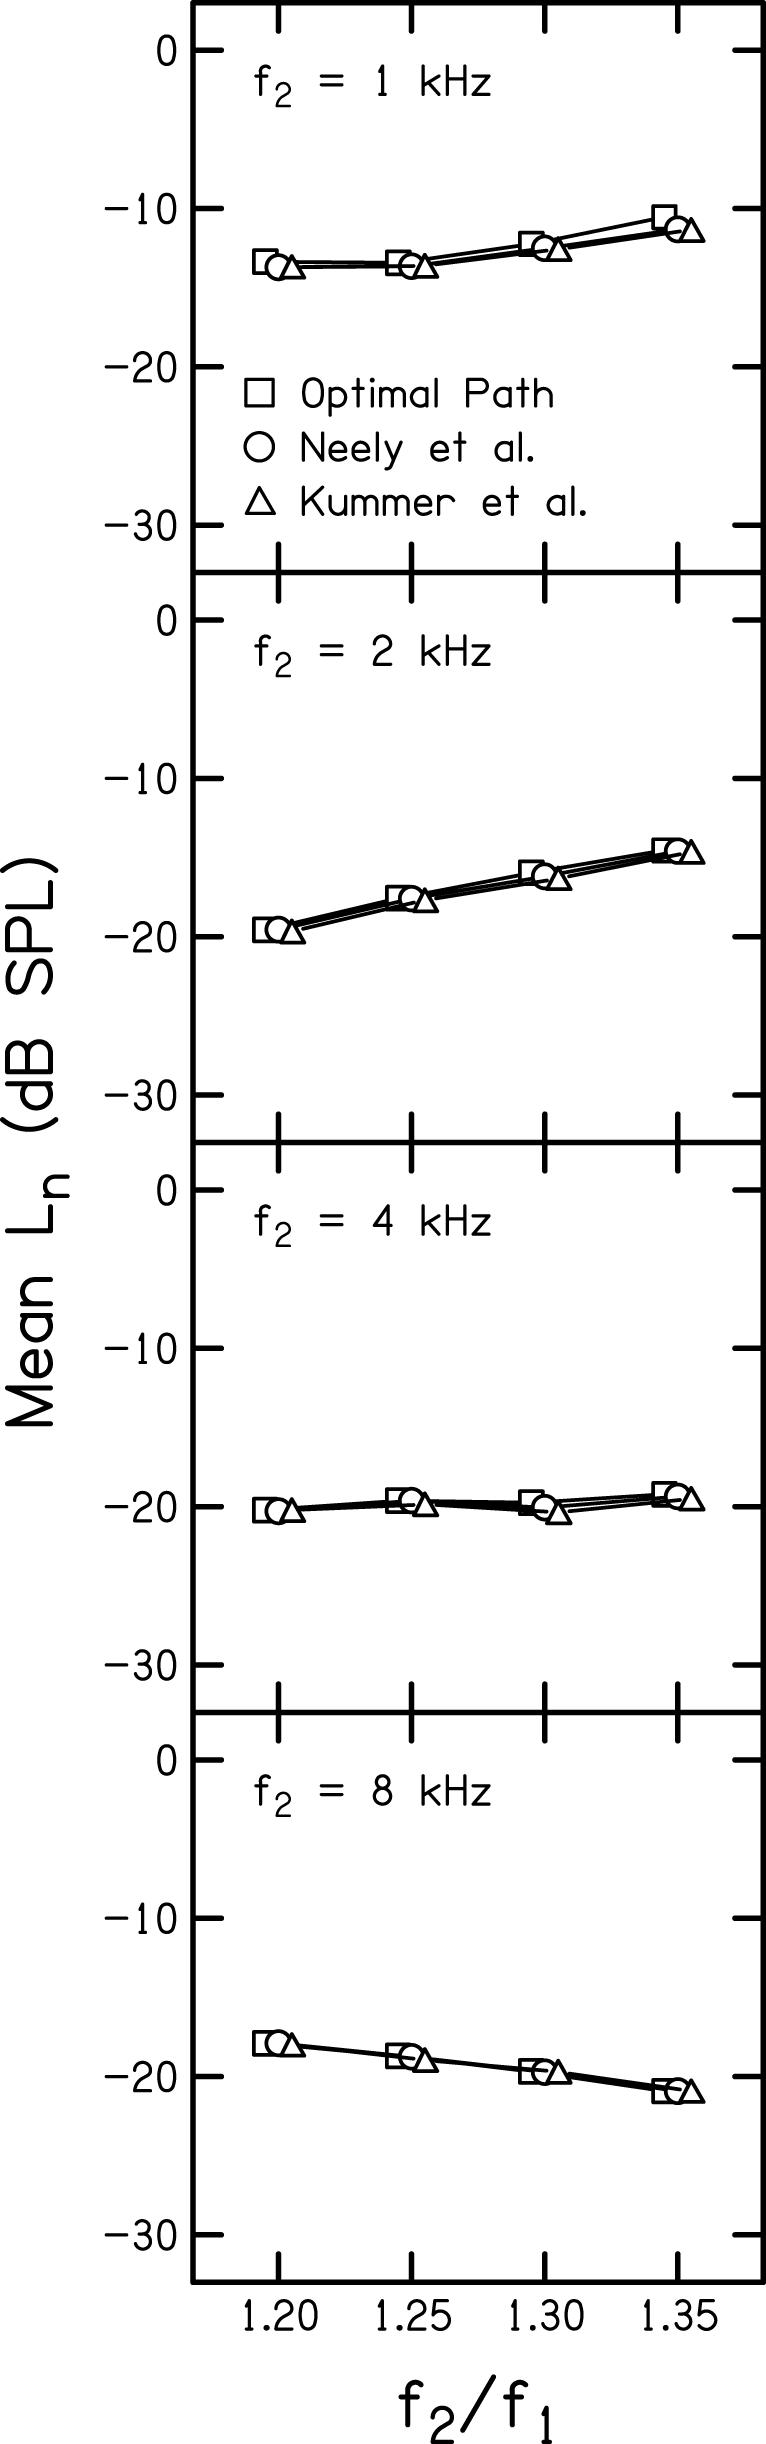
The combined influence of primary-level differences (L1-L2) and primary-frequency ratio (f2/f1) on distortion product otoacoustic emission (DPOAE) level was investigated in 20 normal-hearing subjects. DPOAEs were recorded with continuously varying stimulus levels [Neely et al. J. Acoust. Soc. Am. 117, 1248-1259 (2005)] for the following stimulus conditions: f2= 1, 2, 4, and 8 kHz and f2/f1=1.05 to 1.4; various L1-L2, including one individually optimized to produce the largest DPOAE. For broadly spaced primary frequencies at low L2 levels, the largest DPOAEs were recorded when L1 was much higher than L2, with L1 remaining relatively constant as L2 increased. As f2/fl decreased, the largest DPOAEs were observed when L1 was closer to L2 and increased as L2 increased. Optimal values for L1-L2 and f2 f1 were derived from these data. In general, average DPOAE levels for the new L1-L2 and f2/f1 were equivalent to or larger than those observed for other stimulus combinations, including the L1-L2 described by Kummer et al. [J. Acoust. Soc. Am. 103, 3431-3444 (1998)] and those defined by Neely et al. in which L1-L2 was evaluated, but f2/f1 was fixed at 1.2.
Figures


Similar articles
-
The influence of common stimulus parameters on distortion product otoacoustic emission fine structure.Ear Hear. 2012 Mar-Apr;33(2):239-49. doi: 10.1097/AUD.0b013e3182321da4. Ear Hear. 2012. PMID: 21918451 Clinical Trial.
-
Clinical test performance of distortion-product otoacoustic emissions using new stimulus conditions.Ear Hear. 2010 Feb;31(1):74-83. doi: 10.1097/AUD.0b013e3181b71924. Ear Hear. 2010. PMID: 19701088 Free PMC article.
-
Distortion-product otoacoustic emission measured with continuously varying stimulus level.J Acoust Soc Am. 2005 Mar;117(3 Pt 1):1248-59. doi: 10.1121/1.1853253. J Acoust Soc Am. 2005. PMID: 15807014 Free PMC article.
-
Distortion product otoacoustic emission (2f1-f2) amplitude as a function of f2/f1 frequency ratio and primary tone level separation in human adults and neonates.J Acoust Soc Am. 1996 Dec;100(6):3726-40. doi: 10.1121/1.417234. J Acoust Soc Am. 1996. PMID: 8969474
-
A systematic review of stimulus parameters for eliciting distortion product otoacoustic emissions from adult humans.Int J Audiol. 2017 Jun;56(6):382-391. doi: 10.1080/14992027.2017.1290282. Epub 2017 Feb 20. Int J Audiol. 2017. PMID: 28635500
Cited by
-
Reliability of distortion-product otoacoustic emissions and their relation to loudness.J Acoust Soc Am. 2012 Feb;131(2):1282-95. doi: 10.1121/1.3672654. J Acoust Soc Am. 2012. PMID: 22352502 Free PMC article.
-
Reducing reflected contributions to ear-canal distortion product otoacoustic emissions in humans.J Acoust Soc Am. 2006 Jun;119(6):3896-907. doi: 10.1121/1.2200048. J Acoust Soc Am. 2006. PMID: 16838533 Free PMC article.
-
Growth of suppression using distortion-product otoacoustic emission measurements in hearing-impaired humans.J Acoust Soc Am. 2012 Nov;132(5):3305-18. doi: 10.1121/1.4754526. J Acoust Soc Am. 2012. PMID: 23145614 Free PMC article.
-
Low-frequency and high-frequency distortion product otoacoustic emission suppression in humans.J Acoust Soc Am. 2008 Apr;123(4):2172-90. doi: 10.1121/1.2839138. J Acoust Soc Am. 2008. PMID: 18397024 Free PMC article.
-
Individual differences reveal correlates of hidden hearing deficits.J Neurosci. 2015 Feb 4;35(5):2161-72. doi: 10.1523/JNEUROSCI.3915-14.2015. J Neurosci. 2015. PMID: 25653371 Free PMC article.
References
-
- Abdala C. Distortion product otoacoustic emission (2f1-f2) amplitude growth in human adults and neonates. J. Acoust. Soc. Am. 2000;107:446–456. - PubMed
-
- Abdala C. A longitudinal study of distortion product otoacoustic emission ipsilateral suppression and input/output characteristics in human neonates. J. Acoust. Soc. Am. 2003;114:3239–3250. - PubMed
-
- Abdala C, Fitzgerald TS. Ipsilateral distortion product otoacoustic emission (2f1-f2) suppression in children with sensorineural hearing loss. J. Acoust. Soc. Am. 2003;114:919–31. - PubMed
-
- ANSI . Specifications for audiometers. American National Standards Institute; New York: 1996. ANSI 3.6-1996.
-
- Brown AM, Gaskill SA. Measurement of acoustic distortion reveals underlying similarities between human and rodent mechanical responses. J. Acoust. Soc. Am. 1990;88:840–849. - PubMed
Publication types
MeSH terms
Grants and funding
LinkOut - more resources
Full Text Sources
Other Literature Sources
Research Materials
Miscellaneous