

Raman and infrared microspectral imaging of mitotic cells
- PMID: 16454901
- PMCID: PMC2732123
- DOI: 10.1366/000370206775382758
Raman and infrared microspectral imaging of mitotic cells
Abstract
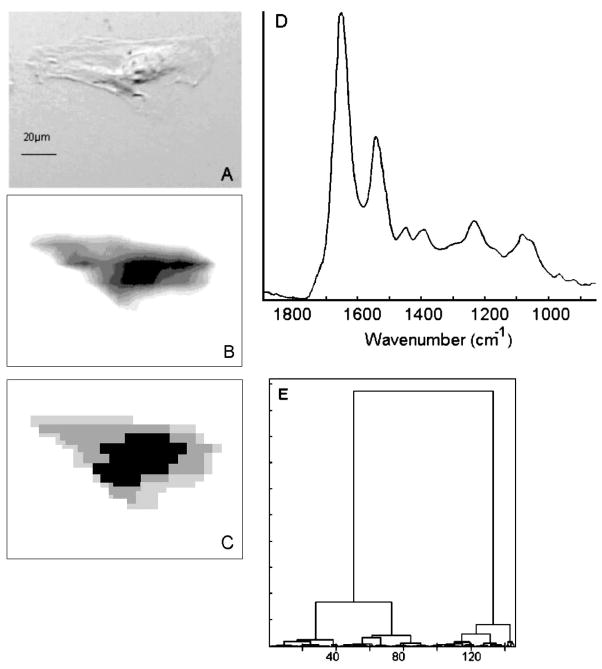
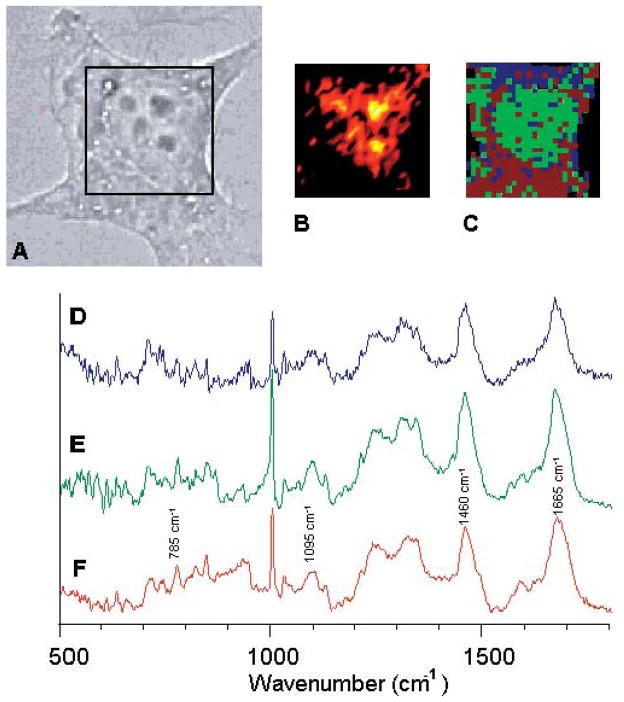
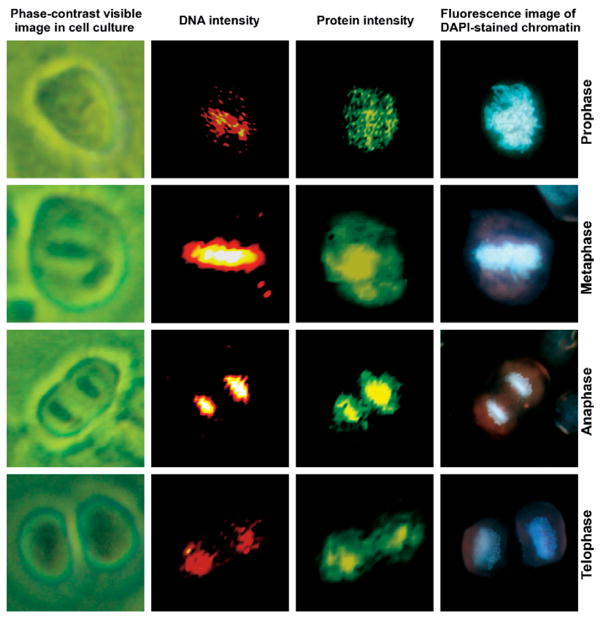
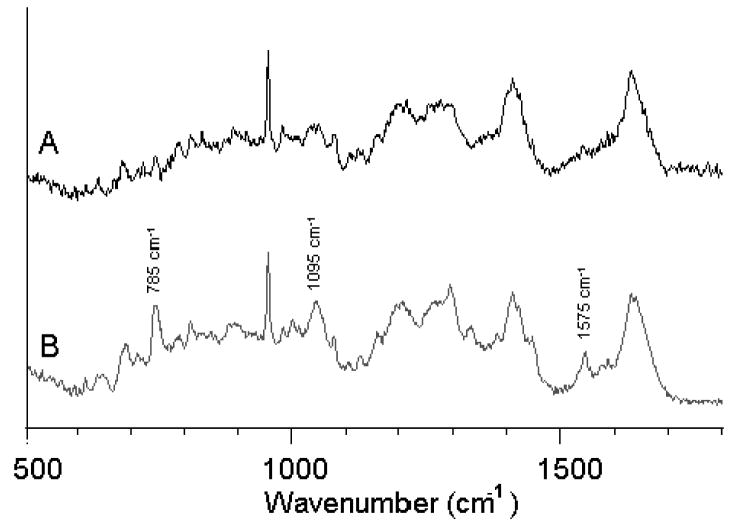
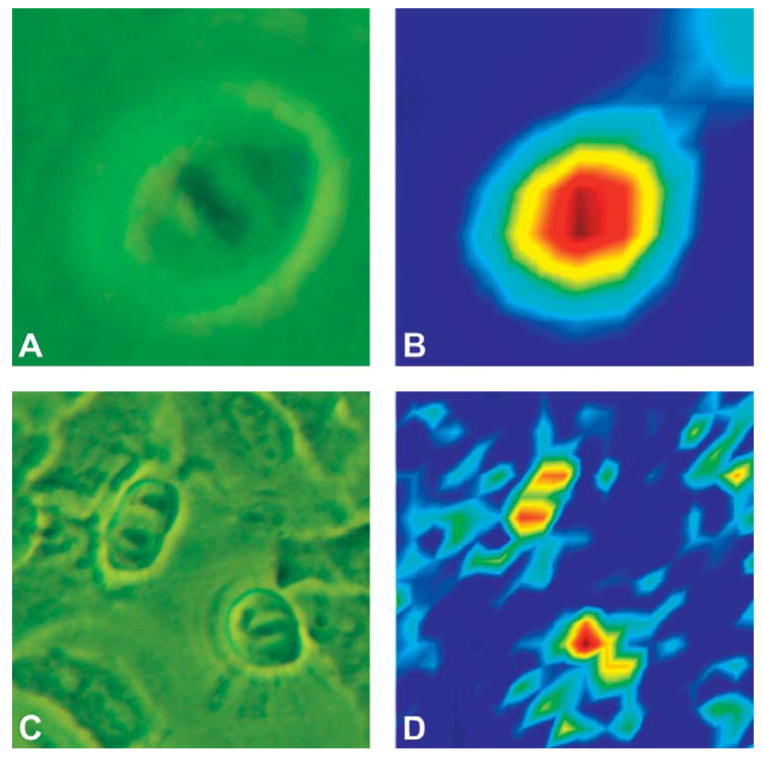
We report the first ever Raman and infrared microspectroscopic images of human cells at different stages of mitosis. These spectroscopic methods monitor the distribution of condensed nuclear chromatin, and other biochemical components, utilizing inherent protein and DNA spectral markers, and, therefore, do not require the use of any stains. In conjunction with previously reported data from the G1, S, and G2 phases of the cell cycle, the complete cell division cycle has now been mapped by spectroscopic methods. Although the results reported here do not offer new insights into the distribution of biochemical components during mitosis, the recognition of cell division without the use of stains, and the possibility of doing so on living cells, may be useful for an automatic, spectroscopic determination of the proliferation rates of cells and tissues. Spectral images were constructed by plotting spectral intensities of DNA or protein versus the coordinates from which spectra were recorded. We found that both Raman and infrared intensities depend on the overall chromatin density variation among the individual subphases of mitosis.
Figures
Similar articles
-
Infrared and Raman imaging spectroscopy of ex vivo skin.Int J Cosmet Sci. 2013 Apr;35(2):125-35. doi: 10.1111/ics.12020. Epub 2012 Nov 29. Int J Cosmet Sci. 2013. PMID: 23106608
-
Nonlinear optical imaging and Raman microspectrometry of the cell nucleus throughout the cell cycle.Biophys J. 2010 Nov 17;99(10):3483-91. doi: 10.1016/j.bpj.2010.06.069. Biophys J. 2010. PMID: 21081098 Free PMC article.
-
Multiplexed Fourier Transform Infrared and Raman Imaging.Methods Mol Biol. 2021;2350:299-312. doi: 10.1007/978-1-0716-1593-5_19. Methods Mol Biol. 2021. PMID: 34331293
-
FTIR and Raman Spectroscopy Applied to Dementia Diagnosis Through Analysis of Biological Fluids.J Alzheimers Dis. 2016 Apr 8;52(3):801-12. doi: 10.3233/JAD-151163. J Alzheimers Dis. 2016. PMID: 27079713 Review.
-
Vibrational spectroscopic methods for cytology and cellular research.Analyst. 2014 Sep 21;139(18):4411-44. doi: 10.1039/c4an00636d. Analyst. 2014. PMID: 25028699 Review.
Cited by
-
Monitoring cellular behaviour using Raman spectroscopy for tissue engineering and regenerative medicine applications.J Mater Sci Mater Med. 2010 Aug;21(8):2317-24. doi: 10.1007/s10856-009-3965-0. Epub 2009 Dec 18. J Mater Sci Mater Med. 2010. PMID: 20020185
-
Subcellular localization of early biochemical transformations in cancer-activated fibroblasts using infrared spectroscopic imaging.Analyst. 2011 Jul 21;136(14):2953-8. doi: 10.1039/c1an15112f. Epub 2011 Jun 7. Analyst. 2011. PMID: 21647505 Free PMC article.
-
High-speed hyperspectral Raman imaging for label-free compositional microanalysis.Biomed Opt Express. 2013 Oct 8;4(11):2376-82. doi: 10.1364/BOE.4.002376. eCollection 2013. Biomed Opt Express. 2013. PMID: 24298401 Free PMC article.
-
Fast infrared chemical imaging with a quantum cascade laser.Anal Chem. 2015 Jan 6;87(1):485-93. doi: 10.1021/ac5027513. Epub 2014 Dec 22. Anal Chem. 2015. PMID: 25474546 Free PMC article.
-
Spectral monitoring of surfactant clearance during alveolar epithelial type II cell differentiation.Biophys J. 2008 Dec 15;95(12):5978-87. doi: 10.1529/biophysj.108.136168. Epub 2008 Sep 26. Biophys J. 2008. PMID: 18820234 Free PMC article.
References
-
- Esposito AP, Talley CE, Huser T, Hollars CW, Schaldach CM, Lane SM. Appl Spectrosc. 2003;57:868. - PubMed
-
- Uzunbajakava N, Lenferink A, Kraan Y, Willekens B, Vrensen G, Greve J, Otto C. Biopolymers. 2003;72:1. - PubMed
-
- Verrier S, Notingher I, Polak JM, Hench LL. Biopolymers. 2004;74:157. - PubMed
-
- Notingher I, Verrier S, Haque S, Polak JM, Hench LL. Biopolymers. 2003;72:230. - PubMed
Publication types
MeSH terms
Substances
Grants and funding
LinkOut - more resources
Full Text Sources
