Homocysteine transport by human aortic endothelial cells: identification and properties of import systems
- PMID: 16455044
- PMCID: PMC2846170
- DOI: 10.1016/j.abb.2005.12.014
Homocysteine transport by human aortic endothelial cells: identification and properties of import systems
Abstract
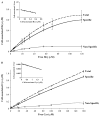
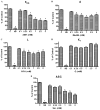
Hyperhomocysteinemia is an independent risk factor for cardiovascular disease. Transport of L-homocysteine into and out of the human vascular endothelium is poorly understood. We hypothesized that cultured human aortic endothelial cells (HAEC) would import L-homocysteine on one or more of the L-cysteine transport systems. Inhibitors of the transporters were used to characterize the uptake of [35S]L-homocysteine, [35S]L-homocystine, and [35S]L-cysteine. We found that L-homocysteine uptake is mediated by the sodium-dependent cysteine transport systems X(AG), ASC, and A, and the sodium-independent transport system L. Thus, HAEC utilize multiple cysteine transporters (X(AG) > or = L > ASC > A) to import L-homocysteine. Kinetic analysis supported the uptake results. Michaelis-Menten constants (Km) for the four systems yielded values of 19.0, 27.1, 112, and 1000 microM for systems L, X(AG), ASC, and A, respectively. The binding and uptake of [35S]L-homocystine, the disulfide homodimer of L-homocysteine, was mediated by systems X(AG), L, and ASC but not by system A. In contrast to [35S]L-homocysteine, system x(c) was active for [35S]L-homocystine uptake. A similar pattern was observed for [35S]L-cysteine. Thus, L-homocysteine and L-homocystine found in hyperhomocysteinemic subjects can gain entry into the vascular endothelium by way of multiple L-cysteine transporters.
Figures


Similar articles
-
Differential regulation of homocysteine transport in vascular endothelial and smooth muscle cells.Arterioscler Thromb Vasc Biol. 2007 Sep;27(9):1976-83. doi: 10.1161/ATVBAHA.107.148544. Arterioscler Thromb Vasc Biol. 2007. PMID: 17715404 Free PMC article.
-
Transport of L-[14C]cystine and L-[14C]cysteine by subtypes of high affinity glutamate transporters over-expressed in HEK cells.Neurochem Int. 2005 Jun;46(8):585-94. doi: 10.1016/j.neuint.2005.03.001. Epub 2005 Apr 12. Neurochem Int. 2005. PMID: 15863236
-
Homocysteine uptake by human umbilical vein endothelial cells in culture.Biochim Biophys Acta. 1990 Sep 24;1054(3):263-6. doi: 10.1016/0167-4889(90)90097-w. Biochim Biophys Acta. 1990. PMID: 2207177
-
Homocysteine is transported by the microvillous plasma membrane of human placenta.J Inherit Metab Dis. 2011 Feb;34(1):57-65. doi: 10.1007/s10545-010-9141-3. Epub 2010 Jun 22. J Inherit Metab Dis. 2011. PMID: 20567909 Free PMC article. Review.
-
[Physiological function of blood-brain barrier transporters as the CNS supporting and protecting system].Yakugaku Zasshi. 2004 Nov;124(11):791-802. doi: 10.1248/yakushi.124.791. Yakugaku Zasshi. 2004. PMID: 15516806 Review. Japanese.
Cited by
-
Restoration of skeletal muscle homeostasis by hydrogen sulfide during hyperhomocysteinemia-mediated oxidative/ER stress condition 1.Can J Physiol Pharmacol. 2019 Jun;97(6):441-456. doi: 10.1139/cjpp-2018-0501. Epub 2018 Nov 13. Can J Physiol Pharmacol. 2019. PMID: 30422673 Free PMC article. Review.
-
High levels of homocysteine downregulate apolipoprotein E expression via nuclear factor kappa B.World J Biol Chem. 2016 Feb 26;7(1):178-87. doi: 10.4331/wjbc.v7.i1.178. World J Biol Chem. 2016. PMID: 26981206 Free PMC article.
-
Homocysteine and Glaucoma.Int J Mol Sci. 2023 Jun 28;24(13):10790. doi: 10.3390/ijms241310790. Int J Mol Sci. 2023. PMID: 37445966 Free PMC article. Review.
-
Association of Inflammatory Markers/Cytokines with Cardiovascular Risk Manifestation in Patients with Endometriosis.Mediators Inflamm. 2021 Oct 31;2021:3425560. doi: 10.1155/2021/3425560. eCollection 2021. Mediators Inflamm. 2021. PMID: 34754275 Free PMC article.
-
Homocysteine: Canary in the Coal Mine or Hidden Threat? A Biochemical Study on the Role of Plasma Thiols.FASEB J. 2025 Jul 15;39(13):e70772. doi: 10.1096/fj.202500677RR. FASEB J. 2025. PMID: 40577064 Free PMC article.
References
-
- Carmel R, Jacobsen DW. Homocysteine in Health and Disease. Cambridge University Press; Cambridge: 2001.
-
- Clarke R, Smith AD, Jobst KA, Refsum H, Sutton L, Ueland PM. Arch Neurol. 1998;55:1449–1455. - PubMed
-
- Seshadri S, Beiser A, Selhub J, Jacques PF, Rosenberg IH, D’Agostino RB, Wilson PWF, Wolf PA. N Engl J Med. 2002;346:476–483. - PubMed
-
- Vollset SE, Refsum H, Irgens LM, Emblem BM, Tverdal A, Gjessing HK, Monsen ALB, Ueland PM. Am J Clin Nutr. 2000;71:962–968. - PubMed
-
- Murphy MM, Scott JM, Arija V, Molloy AM, Fernandez-Ballart JD. Clin Chem. 2004;50:1406–1412. - PubMed
Publication types
MeSH terms
Substances
Grants and funding
LinkOut - more resources
Full Text Sources
Miscellaneous

