. 2006 Apr 1;572(Pt 1):183-200.
doi: 10.1113/jphysiol.2005.099093. Epub 2006 Feb 2.

Modes and models of GABA(A) receptor gating

Affiliations

Modes and models of GABA(A) receptor gating

Gareth M C Lema et al. J Physiol. .

Abstract

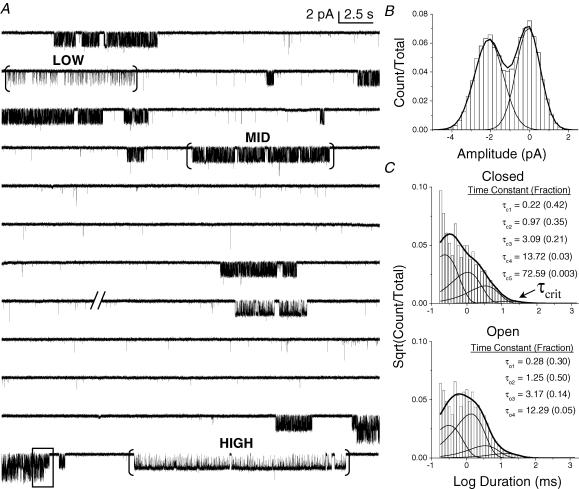
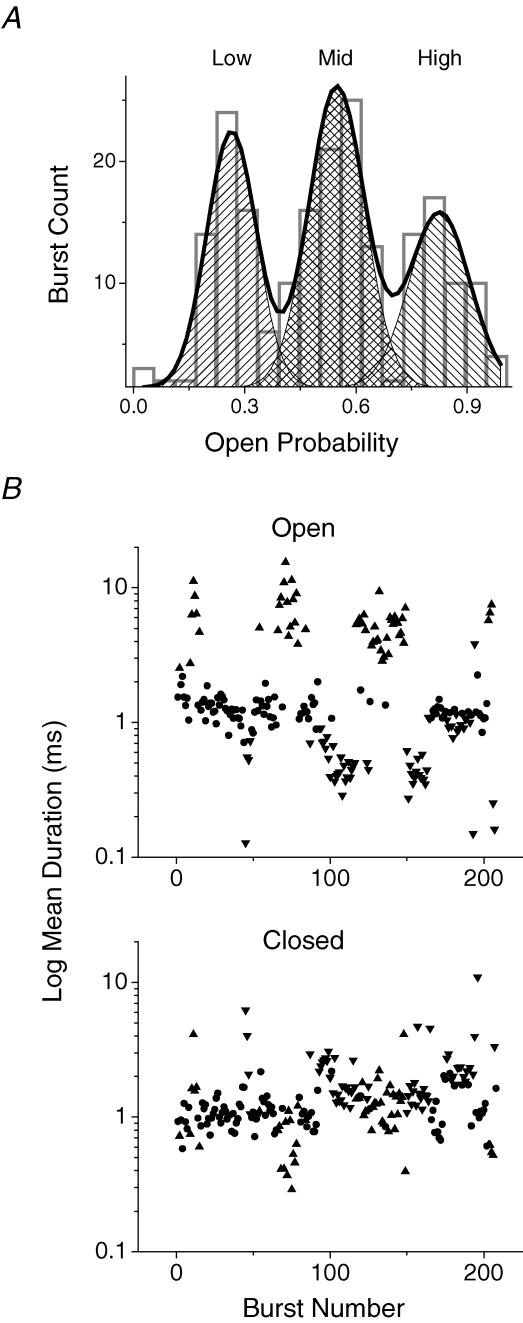
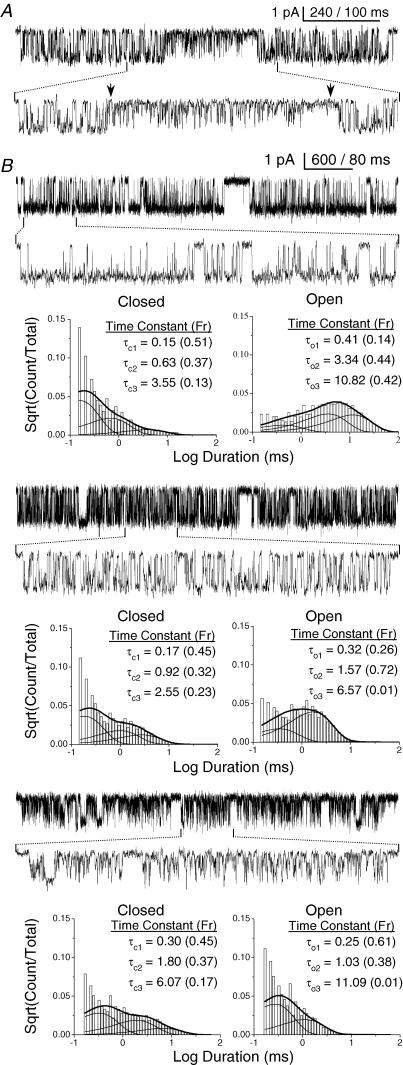
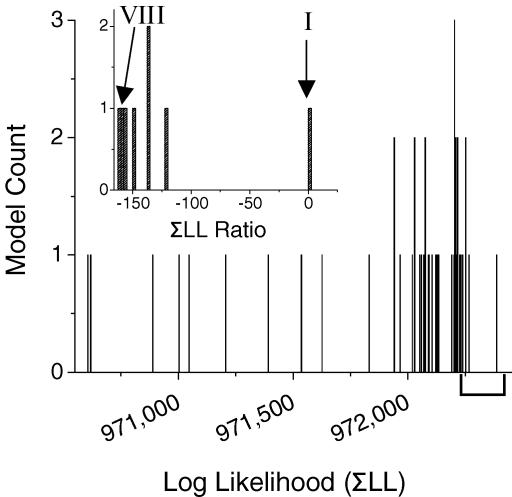
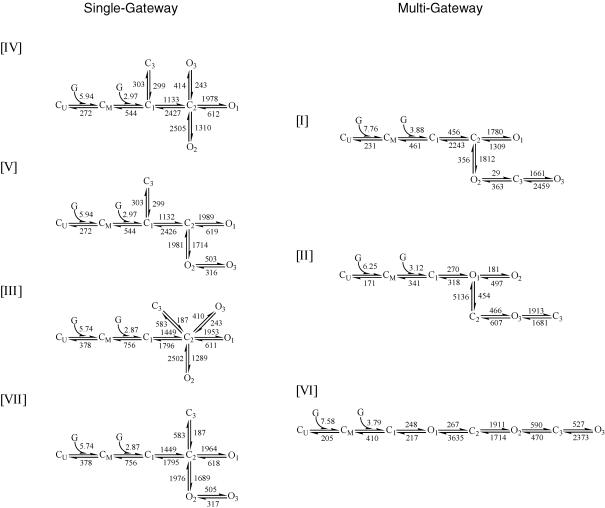
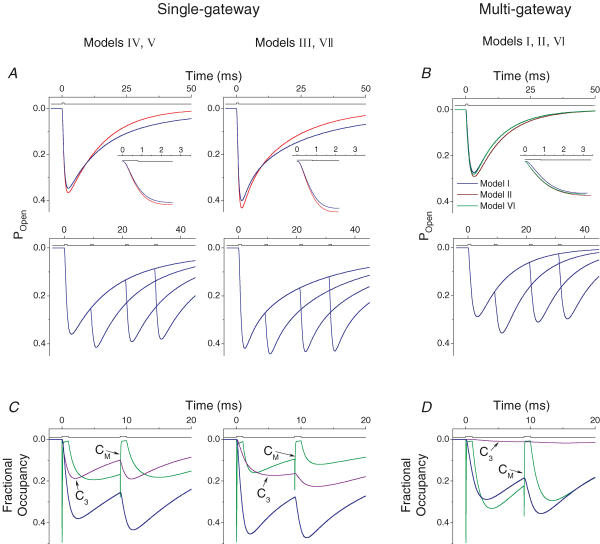
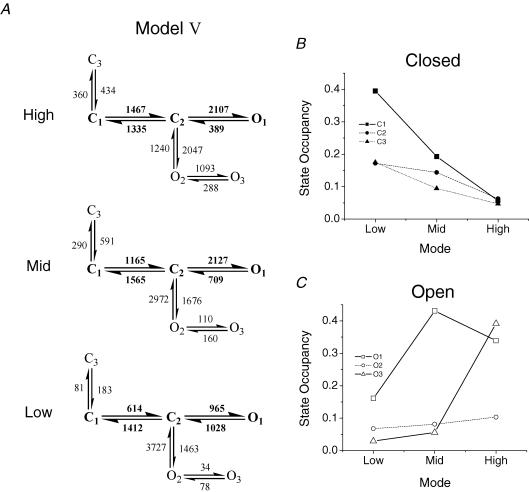
Upon activation by agonist, the type A gamma-aminobutyric acid receptor (GABAR) 'gates', allowing chloride ions to permeate membranes and produce fast inhibition of neurons. There is no consensus kinetic model for the GABAR gating mechanism. We expressed human alpha(1)beta(1)gamma(2S) GABARs in HEK 293 cells and recorded single channel currents in the cell-attached configuration using various GABA concentrations (50-5000 microm). Closed and open events occurred individually and in clusters that had at least three different modes that were distinguishable by open probability (P(O)): High (P(O)= 0.73), Mid (P(O)= 0.50), and Low (P(O)= 0.21). We used a critical time to isolate shorter bursts of openings and to thus eliminate long-lived, desensitized events. Bursts from all three modes contained three closed and three open components. We employed maximum likelihood fitting, autocorrelation analysis and macroscopic current simulation to distinguish kinetic schemes. The 'core' gating scheme for most models contained two closed states that preceded an open state (C(1) C(2) O(1)). The two best-fitting models had a third closed state connected to C(1) and a second open state (O(2)) connected to C(2). The third open state, whose occupancy varied greatly between modes, could be connected either to O(2) or C(2). We estimated rate constants for two identical, independent GABA binding steps by globally fitting data across GABA concentrations ranging from 50 to 1000 microm. For the most highly ranked model the binding rate constants were: k(+)= 3 microm(-1) s(-1) and k(-)= 272 s(-1) (K(D)= 91 microm).


Figures

Figure 1
Figure 1. GABAR gating is heterogeneous and complex
A, 5 min of data from a cell-attached patch on HEK cells expressing human α1, β1, and γ2S GABAR subunits with 5 mm GABA in the pipette. Slashes (//) denote a 3-min section of data that was removed for display purposes. Long closed intervals separate clusters of single channel openings (open is downward). Brackets ([…]) mark clusters that were selected by eye, and each represents a distinct gating mode, designated Low, Mid, and High. The boxed data show the overlap of current from two simultaneously active channels. Data were filtered to 1 kHz for display. B, amplitude histogram for events in all clusters selected by eye (66 in total) showing only two conductance classes. The single-channel current was ∼2 pA when the pipette potential was held at +80 mV. C, dwell time histograms for events in all clusters selected by eye. They were best fitted by a model containing five closed and four open states. Prior to modelling, a τcrit was applied to eliminate events that were not major components of receptor gating (e.g. C4 and C5). A τcrit of 40 ms is marked in the closed time histogram, which corresponds to the τcrit applied to isolate Low PO bursts in the patch.
Figure 2
Figure 2. GABAR gating modes are distinguishable PO
A, histogram showing the distribution of gating modes from the patch shown in Fig. 1. Bursts isolated by a 40-ms τcrit are binned according to PO. The histogram is fitted well by three Gaussian distributions with means of 0.83 (High), 0.55 (Mid) and 0.26 (Low). B, scatter plots of the τO and τC for the same bursts. The mean values for each parameter were: τO = 6.01 (High, ▴), 1.28 (Mid, •) and 0.65 (Low, ▾); τC = 1.15 (High), 1.13 (Mid), and 2.26 (Low).
Figure 3
Figure 3. Bursts exhibit complex gating behaviour
A, a single Mid-mode burst showing a rare change in kinetic activity. The arrow at left indicates a 2-ms closed event, which appears to be the point at which the channel gives rise to a series of short openings. The arrow at right indicates a 14-ms closed event, when the series of short openings appears to end. B, a single cluster is shown for each mode; from top: High, Mid, Low. The low resolution view shows a trace from an eye-selected cluster, while the high resolution view shows a trace from a typical GABAR gating burst. In this patch, the τcrit was 15 ms for High- and Mid-, and 40 ms for Low-mode bursts. Below the traces are the duration histograms for events of the same mode with the time constants and fractional amplitudes. The histograms are overlain by the probability density function (pdf) calculated from the ‘star’ model. Each mode was best fitted by a model containing three closed and three open states. Number of events – High: 17 911; Mid: 80 982; Low: 40 738. Data were filtered to 1 kHz for display.
Figure 4
Figure 4. Models distributed over a range of LL values
A histogram of ΣLL values for fits of 50 GABAR gating models. The ΣLL values were summed from fits of each model to Mid-mode bursts from three patches. One model is not plotted because it could not be fitted to one data set, and thus had a much lower ΣLL value than the rest of the models. Inset is the distribution of the top eight models with the ΣLL ratio plotted on the origin. The top seven models are shown with rate constants from the cross-concentration global fitting in Fig. 7. Model VIII was omitted because it was not highly ranked in the global fitting.
Figure 5
Figure 5. Autocorrelation analysis does not differentiate between models
Autocorrelation functions for Mid-mode bursts (A) and simulated bursts generated from models V (B) and I (C). All Mid-mode bursts were extracted from the same patch. The number of events in each burst is inset in the plot. For models V and I simulations, each plot represents a burst with a different number of total events (approximate values inset). O–O, C–C and O–C correlations are plotted as shown in the legend. The dashed lines are at formula image
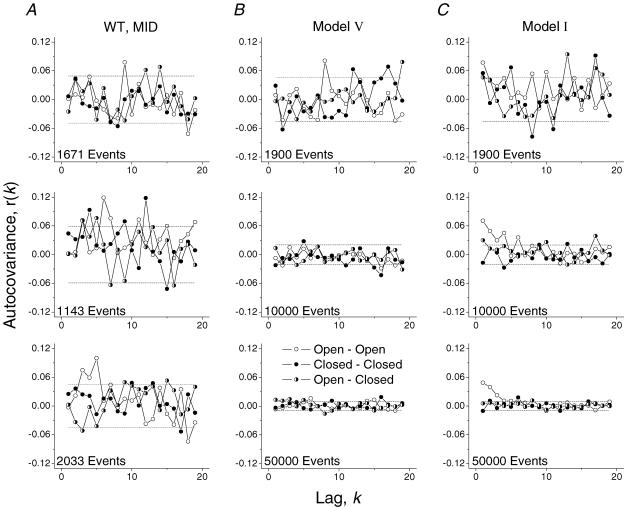
, the standard error of the correlation estimate in the case of white noise.
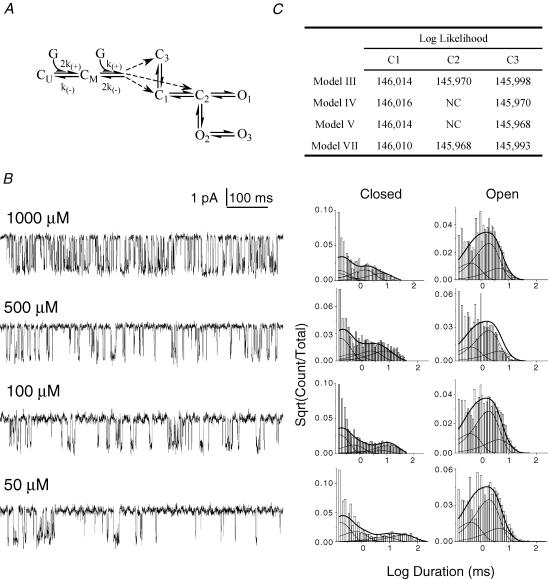
Figure 6
Figure 6. Global fitting across concentrations indicates that GABA binding occurs at a pregateway closed state
A, results of global fitting across concentrations. All 51 models were fitted (to four patches each) with models having two identical binding sites connected, in turn, to each of the fully liganded C states. G = a single GABA molecule; CU = unliganded closed state; CM = monoliganded closed state; numbered C and O states are diliganded; k+ and k are binding and unbinding rate constants, respectively. B, representative data traces from each patch used in the global fitting with closed and open duration histograms for the same patch at right. Probability density functions were calculated using model III (see Fig. 7) with binding steps added to C1. The number of events in each patch ranged from 5000 to 9000 (total = 27 256). C, the LL values for the fitting of the four single-gateway models with binding connected to each of the closed states. NC: no convergence, the model could not be fitted to the data with binding connected at the particular C state.
Figure 7
Figure 7. Kinetic models
The top seven models with rate constants calculated from global fitting across GABA concentrations. Models are divided into single-gateway and multigateway subsets and numbered according to their rank in the fitting at 5 mm GABA (Fig. 4). KD values (μm) for each model are: I, 59.5; II, 54.8; III, 131.7; IV, 91.6; V, 91.58; VI, 54.1; VII, 131.7.
Figure 8
Figure 8. Simulated macroscopic responses from GABAR gating models
Simulations of single-gateway models are shown in the left and centre columns (A and C). Simulations of multigateway models are shown in the right column (B and D). Models IV and V, and models III and VII predicted identical macroscopic responses. A and B, simulations using the protocols of MT. In A red curves were generated from Mid-mode models, while blue curves were generated from models of all three modes combined. In B the navy, dark green and brown curves were generated from Mid-mode models of I, II and VI, respectively. Upper traces show the simulated responses to a single 800 μs pulse with high resolution views of the activation phases inset. Lower traces show the simulated responses to paired-pulses. In B, only the paired-pluse for model I is shown. C and D, the occupancies of closed components CM (green) and C3 (violet) during the response to the paired-pulses separated by an 8-ms interval (from A and B). When C3 branches from C1 (the pregateway state), more receptors occupy the monoliganded state when the second agonist pulse is applied. When C3 branches from C2, it traps receptors in a state that is insensitive to the second agonist application. In model I, C3 is rarely accessed do to a slow rate of entry.
Figure 9
Figure 9. Comparison of gating modes activated by 5 mm GABA
A, model V with rate constants for the High, Mid and Low gating modes estimated from patches acquired with 5 mm GABA in the pipette. The core mechanism is shown in bold. Rate constants in the Mid-mode model were averaged from 3 patches; rate constants in the High- and Low-mode models were averaged from 2 patches. B and C, the equilibrium state occupancy probabilities (calculated from the rate constants in model V) of the closed (B) and open (C) states plotted versus the kinetic mode. Closed states are plotted as filled symbols, while open states are plotted as open symbols. Lines merely connect the data points, and are not fits to the data. The thick, continuous lines give emphasis to the states that vary by more than 10% between modes.

References

    1. Akk G, Bracamontes JR, Covey DF, Evers A, Dao T, Steinbach JH. Neuroactive steroids have multiple actions to potentiate GABAA receptors. J Physiol. 2004;558:59–74. - PMC - PubMed
    1. Angelotti TP, Macdonald RL. Assembly of GABAA receptor subunits: α1β1 and α1β1γ2S subunits produce unique ion channels with dissimilar single-channel properties. J Neurosci. 1993;13:1429–1440. - PMC - PubMed
    1. Auerbach A. Gating of acetylcholine receptor channels: brownian motion across a broad transition state. Proc Natl Acad Sci U S A. 2005;102:1408–1412. - PMC - PubMed
    1. Auerbach A, Zhou Y. Gating reaction mechanisms for NMDA receptor channels. J Neurosci. 2005;25:7914–7923. - PMC - PubMed
    1. Bailey DJ, Tetzlaff JE, Cook JM, He X, Helmstetter FJ. Effects of hippocampal injections of a novel ligand selective for the α5β2γ2 subunits of the GABA/benzodiazepine receptor on Pavlovian conditioning. Neurobiol Learn Mem. 2002;78:1–10. - PubMed

Publication types

MeSH terms

LinkOut - more resources