Correlation of disease severity with fecal toxin levels in patients with Clostridium difficile-associated diarrhea and distribution of PCR ribotypes and toxin yields in vitro of corresponding isolates
- PMID: 16455883
- PMCID: PMC1392646
- DOI: 10.1128/JCM.44.2.353-358.2006
Correlation of disease severity with fecal toxin levels in patients with Clostridium difficile-associated diarrhea and distribution of PCR ribotypes and toxin yields in vitro of corresponding isolates
Abstract
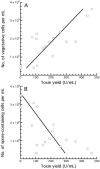
We investigated in vivo and in vitro yields of toxins A and B from and PCR ribotypes of Clostridium difficile isolates from 164 patients with differing severities of C. difficile-associated diarrhea (CDAD) (patients were grouped as follows: <3 loose stools per day, n = 45; 3 to 10 per day, n = 97; >10 per day, n = 22). The median fecal toxin levels in each group were 0.5, 6.8, and 149 U/g feces (P < 0.001), respectively. Patients with severe diarrhea also had more-frequent occurrence of blood in stool and vomiting, but there was no association with fecal toxin levels per se. There was no correlation between fecal toxin level and toxin yield in vitro for the corresponding C. difficile isolate or between its PCR ribotype and disease severity. A broad range of toxin yields among isolates belonging to major PCR ribotypes indicated a presence of many subtypes. We hypothesize that bacterial and host factors that affect C. difficile toxin levels in feces are important determinants of symptoms in CDAD patients. An inverse correlation between toxin yield and spore count (r = 0.66) in stationary-phase cultures supported the notion that toxin production and sporulation represent opposite alternative survival strategies for C. difficile cells facing nutrient shortage.
Figures


References
-
- Blake, J. E., F. Mitsikosta, and M. A. Metcalfe. 2004. Immunological detection and cytotoxic properties of toxins from toxin A-positive, toxin B-positive Clostridium difficile variants. J. Med. Microbiol. 53:197-205. - PubMed
-
- Boriello, S. P., J. M. Ketley, T. J. Mitchell, F. E. Barclay, A. R. Welch, A. B. Price, and J. Stephen. 1987. Clostridium difficile—a spectrum of virulence and analysis of putative virulence determinants in the hamster model of antibiotic-associated colitis. J. Med. Microbiol. 24:53-64. - PubMed
-
- Brazier, J. S. 2001. Typing of Clostridium difficile. Clin. Microbiol. Infect. 7:428-431. - PubMed
-
- Cheng, S. H., J. J. Lu, T. G. Young, C. L. Perng, and W. M. Chi. 1997. Clostridium difficile-associated diseases: comparison of symptomatic infection versus carriage rate on the basis of risk factors, toxin production, and genotyping results. Clin. Infect. Dis. 25:157-158. - PubMed
Publication types
MeSH terms
Substances
LinkOut - more resources
Full Text Sources
Other Literature Sources
Medical
Molecular Biology Databases

