

Normalization approaches for removing systematic biases associated with mass spectrometry and label-free proteomics
- PMID: 16457593
- PMCID: PMC1992440
- DOI: 10.1021/pr050300l
Normalization approaches for removing systematic biases associated with mass spectrometry and label-free proteomics
Abstract
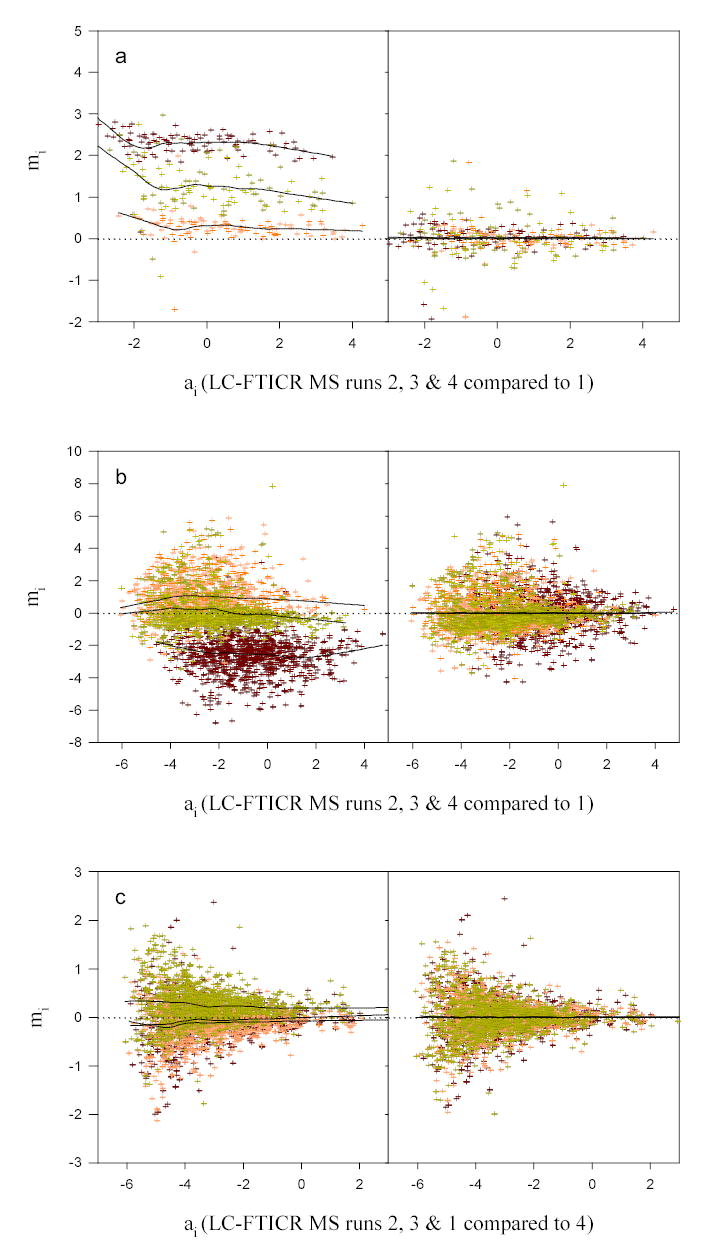
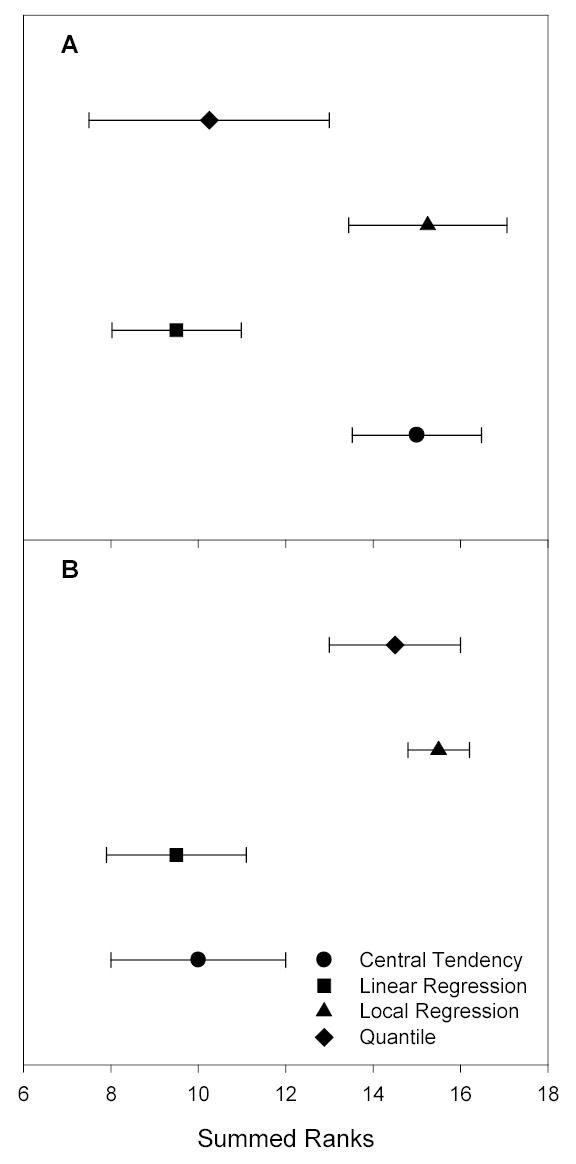
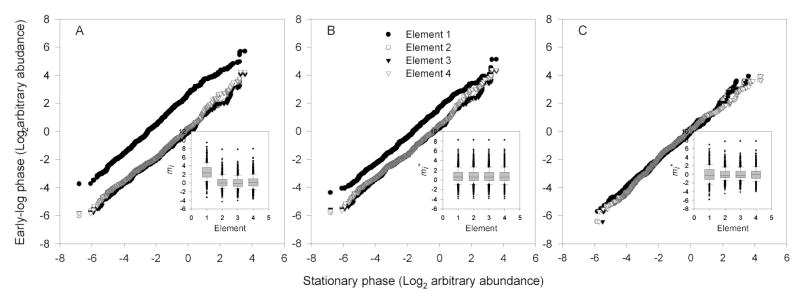
Central tendency, linear regression, locally weighted regression, and quantile techniques were investigated for normalization of peptide abundance measurements obtained from high-throughput liquid chromatography-Fourier transform ion cyclotron resonance mass spectrometry (LC-FTICR MS). Arbitrary abundances of peptides were obtained from three sample sets, including a standard protein sample, two Deinococcus radiodurans samples taken from different growth phases, and two mouse striatum samples from control and methamphetamine-stressed mice (strain C57BL/6). The selected normalization techniques were evaluated in both the absence and presence of biological variability by estimating extraneous variability prior to and following normalization. Prior to normalization, replicate runs from each sample set were observed to be statistically different, while following normalization replicate runs were no longer statistically different. Although all techniques reduced systematic bias to some degree, assigned ranks among the techniques revealed that for most LC-FTICR-MS analyses linear regression normalization ranked either first or second. However, the lack of a definitive trend among the techniques suggested the need for additional investigation into adapting normalization approaches for label-free proteomics. Nevertheless, this study serves as an important step for evaluating approaches that address systematic biases related to relative quantification and label-free proteomics.
Figures
References
-
- Lipton MS, Pasa-Tolic L, Anderson GA, Anderson DJ, Auberry DL, Battista KR, Daly MJ, Fredrickson J, Hixson KK, Kostandarithes H, Masselon C, Markillie LM, Moore RJ, Romine MF, Shen YF, Stritmatter E, Tolic N, Udseth HR, Venkateswaran A, Wong LK, Zhao R, Smith RD. Proc Natl Acad Sci U S A. 2002;99:11049–11054. - PMC - PubMed
-
- Smith RD. Proteomics. 2002;2:513 – 523. - PubMed
-
- Pasa-Tolic L, Jensen PK, Anderson GA, Lipton MS, Peden KK, Martinovic S, Tolic N, Bruce JE, Smith RD. J Am Chem Soc. 1999;121:7949–7950.
-
- Gygi SP, Rist B, Gerber SA, Turecek F, Gelb MH, Aebersold R. Nat Biotechnol. 1999;17:994–999. - PubMed
-
- Qiu YC, Sousa EA, Hewick RM, Wang JH. Anal Chem. 2002;74:4969–4979. - PubMed
Publication types
MeSH terms
Substances
Grants and funding
LinkOut - more resources
Full Text Sources
Other Literature Sources
