

Characterization of the mouse brain proteome using global proteomic analysis complemented with cysteinyl-peptide enrichment
- PMID: 16457602
- PMCID: PMC1850945
- DOI: 10.1021/pr0503681
Characterization of the mouse brain proteome using global proteomic analysis complemented with cysteinyl-peptide enrichment
Abstract
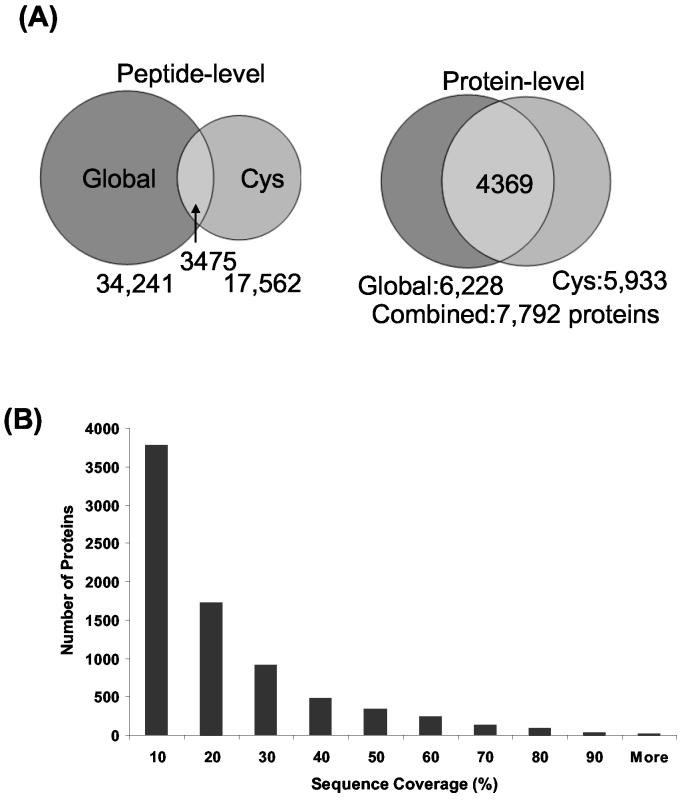
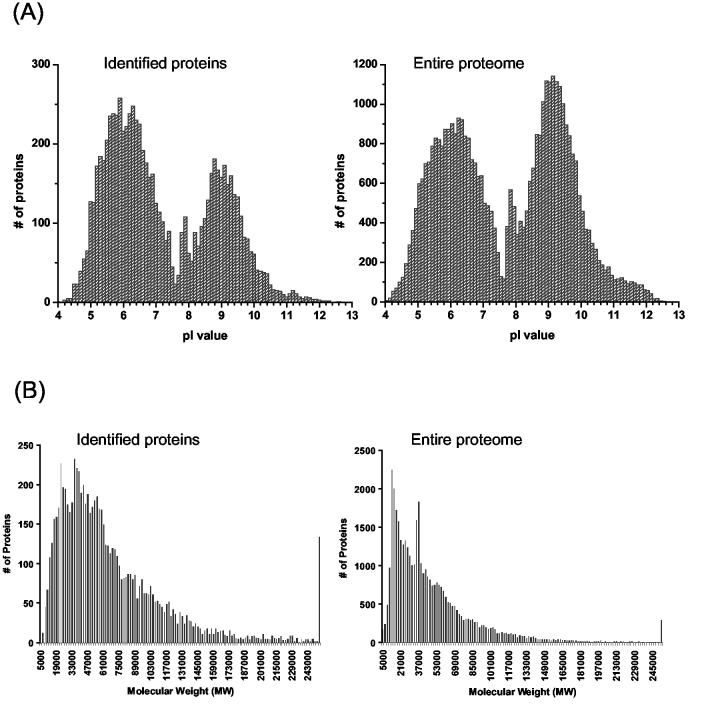
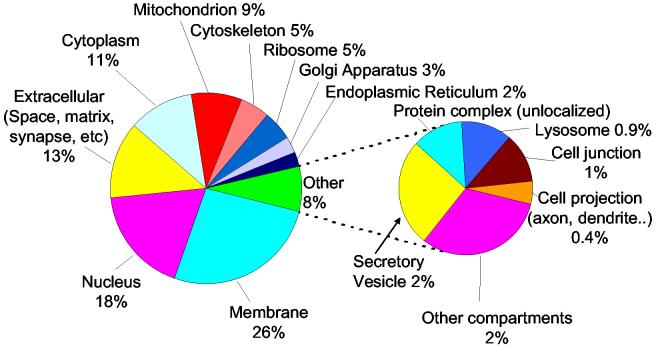
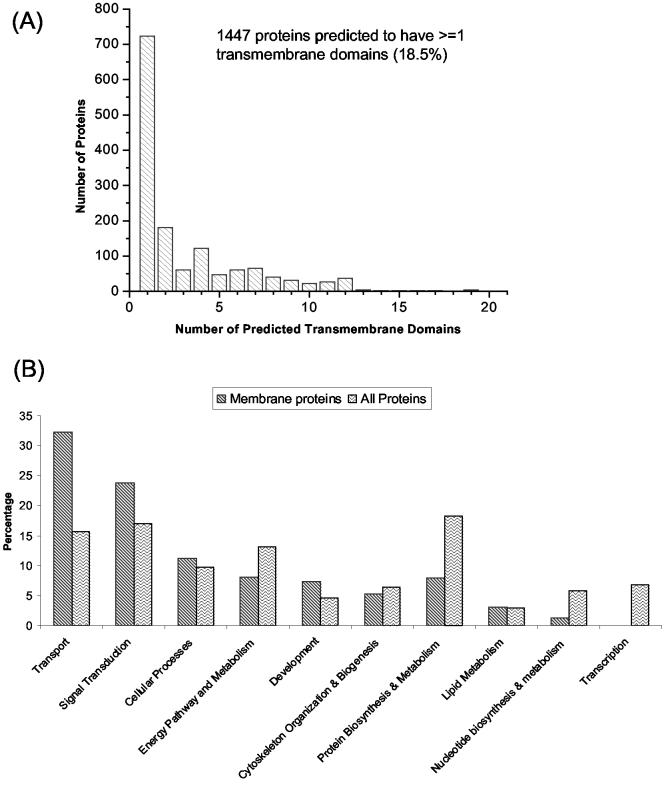
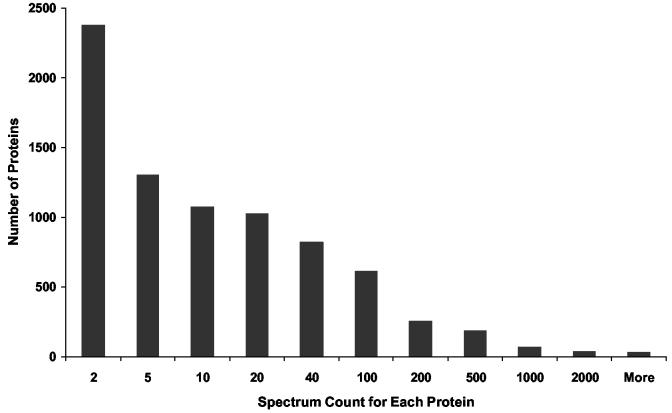
We report a global proteomic approach for analyzing brain tissue and for the first time a comprehensive characterization of the whole mouse brain proteome. Preparation of the whole brain sample incorporated a highly efficient cysteinyl-peptide enrichment (CPE) technique to complement a global enzymatic digestion method. Both the global and the cysteinyl-enriched peptide samples were analyzed by SCX fractionation coupled with reversed phase LC-MS/MS analysis. A total of 48,328 different peptides were confidently identified (>98% confidence level), covering 7792 nonredundant proteins ( approximately 34% of the predicted mouse proteome). A total of 1564 and 1859 proteins were identified exclusively from the cysteinyl-peptide and the global peptide samples, respectively, corresponding to 25% and 31% improvements in proteome coverage compared to analysis of only the global peptide or cysteinyl-peptide samples. The identified proteins provide a broad representation of the mouse proteome with little bias evident due to protein pI, molecular weight, and/or cellular localization. Approximately 26% of the identified proteins with gene ontology (GO) annotations were membrane proteins, with 1447 proteins predicted to have transmembrane domains, and many of the membrane proteins were found to be involved in transport and cell signaling. The MS/MS spectrum count information for the identified proteins was used to provide a measure of relative protein abundances. The mouse brain peptide/protein database generated from this study represents the most comprehensive proteome coverage for the mammalian brain to date, and the basis for future quantitative brain proteomic studies using mouse models. The proteomic approach presented here may have broad applications for rapid proteomic analyses of various mouse models of human brain diseases.
Figures

References
-
- Peterson AS. Pixelating the brain. Genome Res. 2002;12(2):217–218. - PubMed
-
- Carson JP, Thaller C, Eichele G. A transcriptome atlas of the mouse brain at cellular resolution. Curr Opin Neurobiol. 2002;12(5):562–5. - PubMed
-
- Allen Brain Atlas. www.brain-map.org.
-
- Singh RP, Smith DJ. Genome scale mapping of brain gene expression. Biol Psychiatry. 2003;53(12):1069–74. - PubMed
-
- Stoeckli M, Chaurand P, Hallahan DE, Caprioli RM. Imaging mass spectrometry: a new technology for the analysis of protein expression in mammalian tissues. Nat. Med. 2001;7493-6(4):493–496. - PubMed
Publication types
MeSH terms
Substances
Grants and funding
LinkOut - more resources
Full Text Sources
Molecular Biology Databases
Research Materials
Miscellaneous
