Differing myocardial response to a single session of hemodialysis in end-stage renal disease with and without type 2 diabetes mellitus and coronary artery disease
- PMID: 16457710
- PMCID: PMC1382277
- DOI: 10.1186/1476-7120-4-9
Differing myocardial response to a single session of hemodialysis in end-stage renal disease with and without type 2 diabetes mellitus and coronary artery disease
Abstract
Background: Though hemodialysis (HD) acutely improves cardiac function, the impact of background diseases like coronary artery disease (CAD) and Type 2 diabetes (DM) in the setting of end-stage renal disease (ESRD) is not known. Tissue velocity echocardiography (TVE) offers a fast choice to follow changes in myocardial function after HD in ESRD with concomitant DM and /or CAD.
Methods: 46 subjects (17 with ESRD, Group 1; 15 with DM, Group 2; 14 with DM+CAD, Group 3) underwent standard and TVE prior to and shortly after HD. Besides standard Doppler variables, regional myocardial systolic and diastolic velocities, as well as systolic strain rate were post processed.
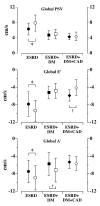
Results: Compared with pre-HD, post-HD body weight (kg) significantly decreased in all the three groups (51 +/- 9 vs. 48 +/- 8, 62 +/- 10 vs.59 +/- 10, and 61 +/- 9 vs. 58 +/- 9 respectively; all p < 0.01). Left ventricular end diastolic dimensions (mm) also decreased post- HD (46 +/- 5 vs. 42 +/- 7, 53 +/- 7 vs. 50 +/- 7, 51 +/- 7 vs. 47 +/- 8 respectively; all p < 0.01). Regional longitudinal peak systolic velocity in septum (cm/s) significantly increased post-HD in Group 1(5.7 +/- 1.6 vs. 7.2 +/- 2.3; p < 0.001) while remained unchanged in the other two groups. Similar trends were noted in other left ventricular walls. When the myocardial velocities (cm/s) were computed globally, the improvement was seen only in Group 1 (6.3 +/- 1.5 vs. 7.9 +/- 2.0; p < 0.001). Global early regional diastolic velocity (cm/s) improved in Group 1, remained unchanged in Group 2, while significantly decreased in Group 3(-5.9 +/- 1.3 vs. -4.1 +/- 1.8; p < 0.01). Global systolic strain rate (1/sec) increased in the first 2 Groups but remained unchanged (-0.87 +/- 0.4 vs. -0.94 +/- 0.3; p = ns) in Group 3.
Conclusion: A single HD session improves LV function only in ESRD without coexistent DM and/or CAD. The present data suggest that not only dialysis-dependent changes in loading conditions but also co-existent background diseases determine the myocardial response to HD.
Figures


References
-
- American Diabetes Association Position Statement Nephropathy in Diabetes. Diabetes Care. 2004;27:79S–83S.
-
- Grundy SM, Benjamin IJ, Burke GL, Chait A, Eckel RH, Howard BV, et al. Diabetes and cardiovascular disease: a statement for healthcare professionals from the American Heart Association. Circulation. 1999;200:1134–46. - PubMed
-
- Eknoyan G. On the epidemic of cardiovascular disease in patients with chronic renal disease and progressive renal failure: a first step to improve the outcomes. Am J Kidney Dis. 1998;32:S1–S4. - PubMed
-
- Foley RN, Parfrey PS, Sarnak MJ. Clinical Epidemiology of cardiovascular disease in chronic renal disease. Am J Kidney Dis. 1998;32:S112–S119. - PubMed
Publication types
MeSH terms
LinkOut - more resources
Full Text Sources
Medical
Miscellaneous

