. 2006 Mar;1762(3):362-72.
doi: 10.1016/j.bbadis.2005.11.006.

Pathological pattern of Mdx mice diaphragm correlates with gradual expression of the short utrophin isoform Up71

Affiliations

Pathological pattern of Mdx mice diaphragm correlates with gradual expression of the short utrophin isoform Up71

Karim Hnia et al. Biochim Biophys Acta. 2006 Mar.

Abstract

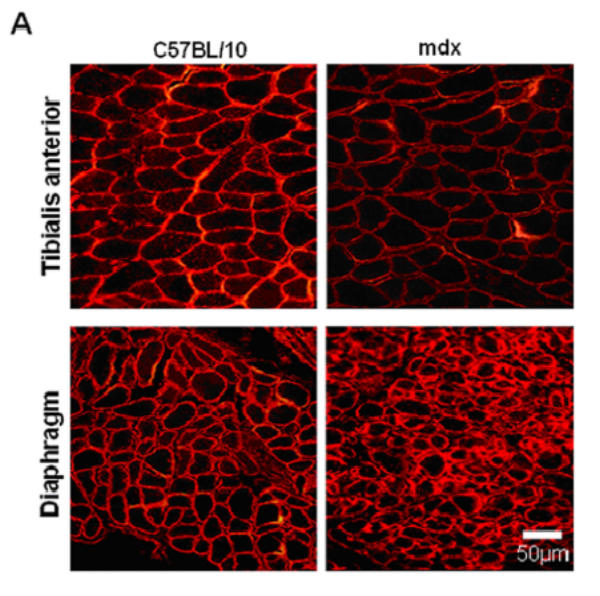
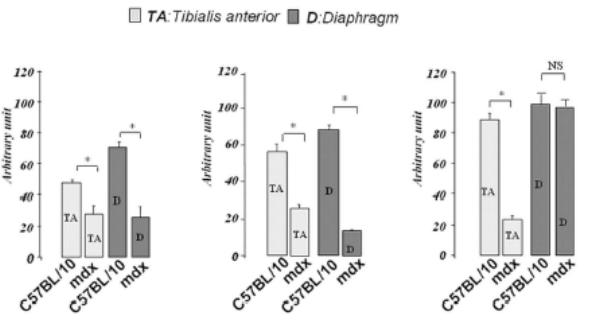
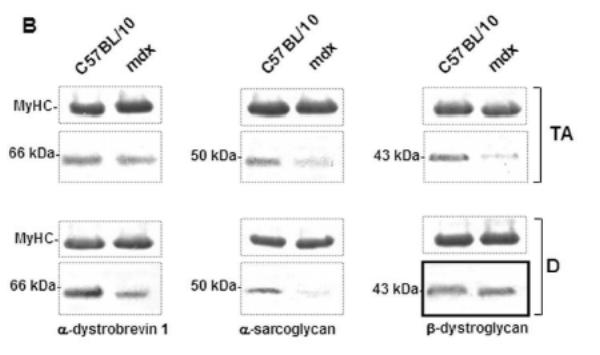
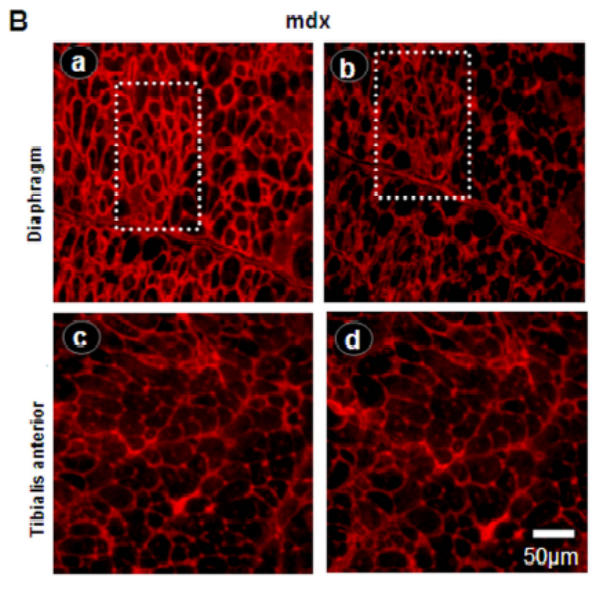
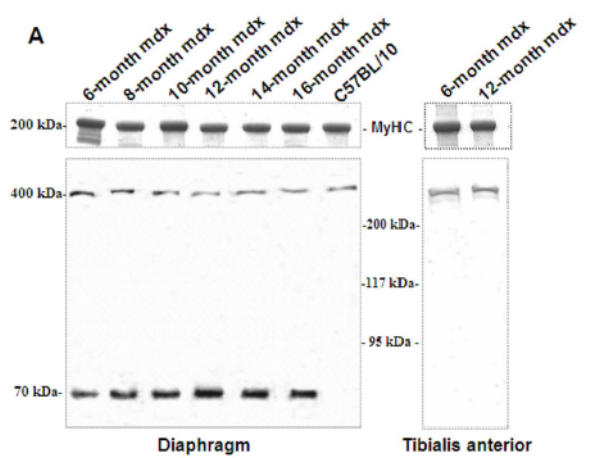
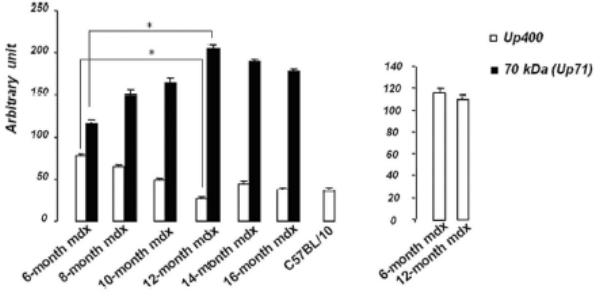
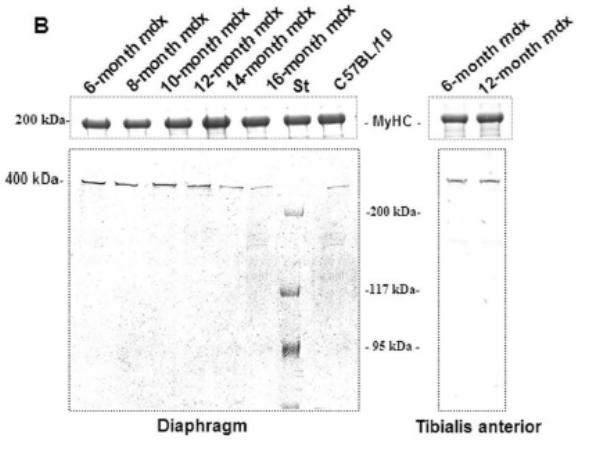
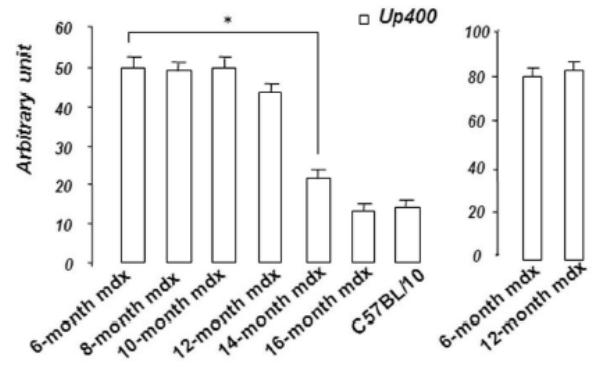
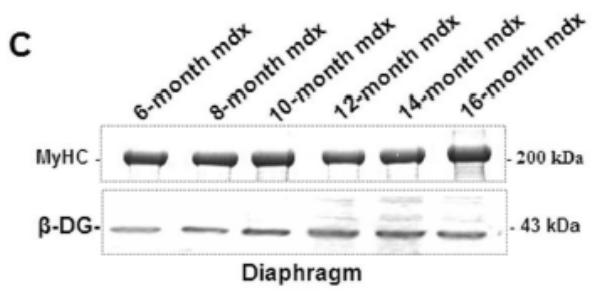
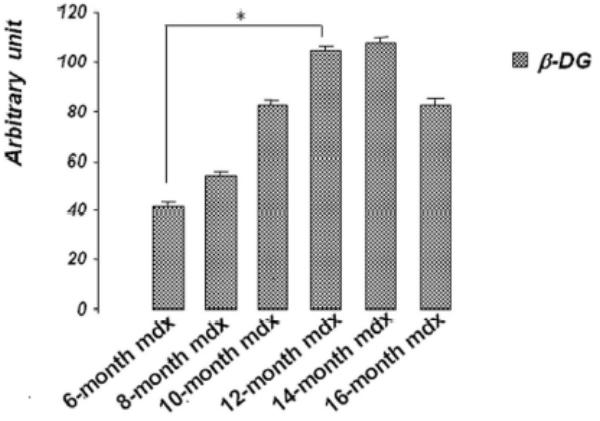
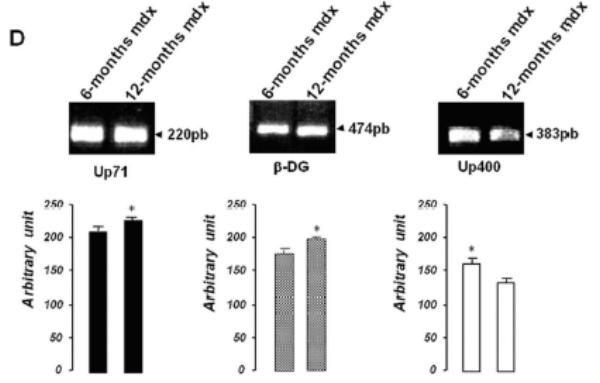
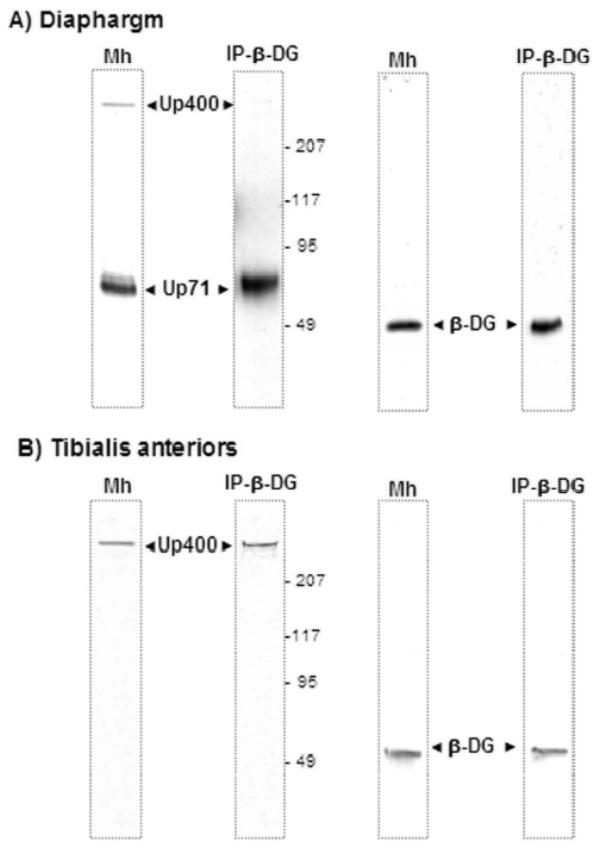
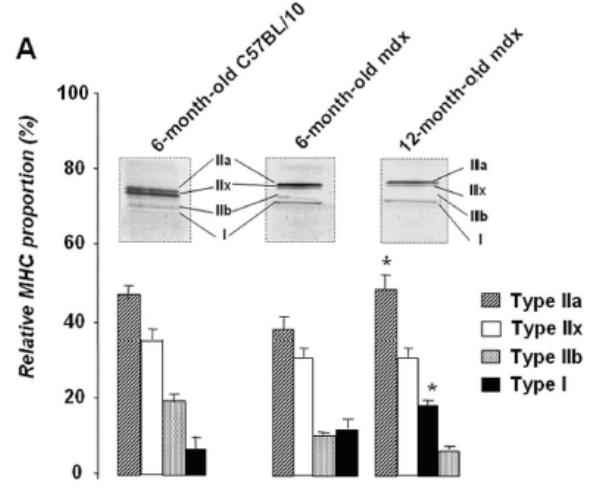
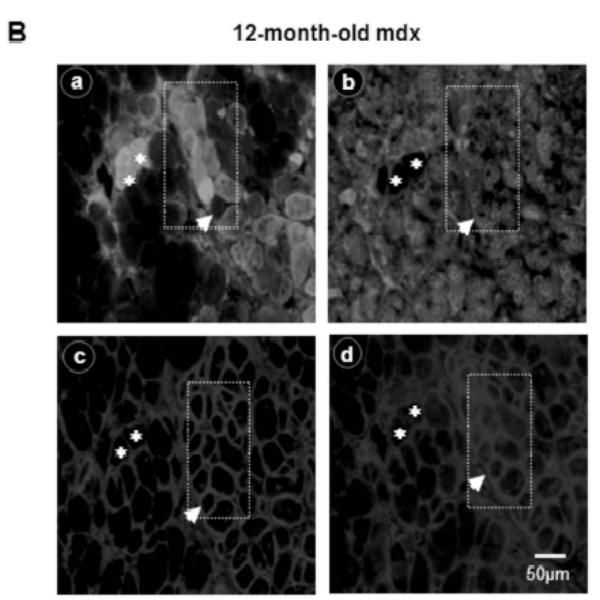
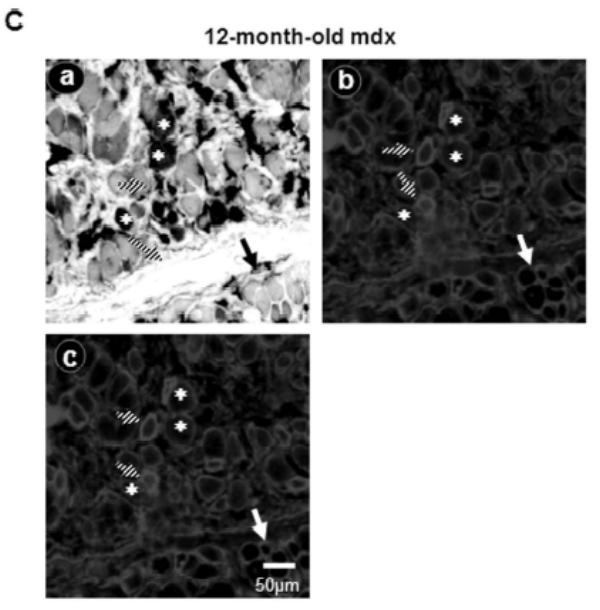
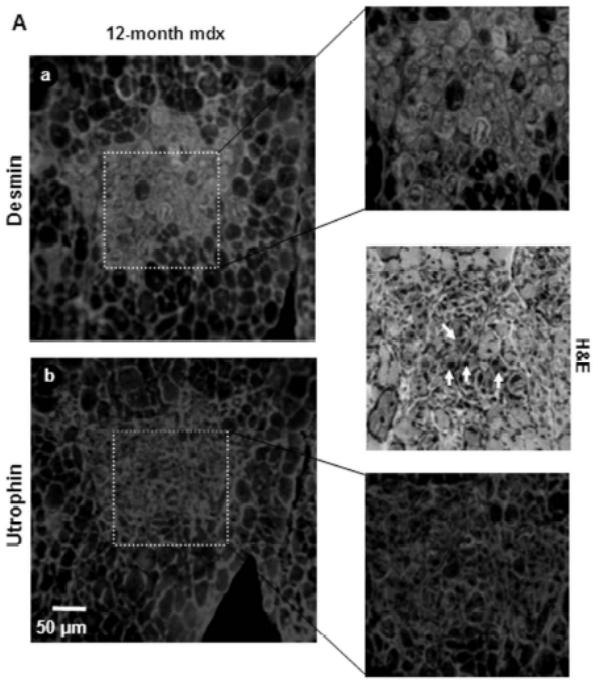
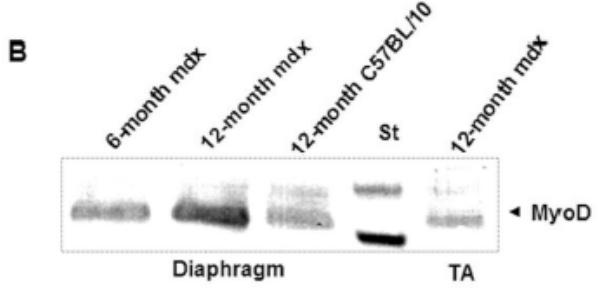
Utrophin gene is transcribed in a large mRNA of 13 kb that codes for a protein of 395 kDa. It shows amino acid identity with dystrophin of up to 73% and is widely expressed in muscle and non-muscle tissues. Up71 is a short utrophin product of the utrophin gene with the same cysteine-rich and C-terminal domains as full-length utrophin (Up395). Using RT-PCR, Western blots analysis, we demonstrated that Up71 is overexpressed in the mdx diaphragm, the most pathological muscle in dystrophin-deficient mdx mice, compared to wild-type C57BL/10 or other mdx skeletal muscles. Subsequently, we demonstrated that this isoform displayed an increased expression level up to 12 months, whereas full-length utrophin (Up395) decreased. In addition, beta-dystroglycan, the transmembrane glycoprotein that anchors the cytoplasmic C-terminal domain of utrophin, showed similar increase expression in mdx diaphragm, as opposed to other components of the dystrophin-associated protein complex (DAPC) such as alpha-dystrobrevin1 and alpha-sarcoglycan. We demonstrated that Up71 and beta-dystroglycan were progressively accumulated along the extrasynaptic region of regenerating clusters in mdx diaphragm. Our data provide novel functional insights into the pathological role of the Up71 isoform in dystrophinopathies.


Figures

Figure 1
Figure 1. β-DG, α-DB and α-SG in 2-month-old mdx and C57BL/10 mice
A: Immunofluorescence detection of β-DG on cryostat sections of diaphragm and tibialis anterior (TA) from mdx and wild-type C57BL/10 mice. As shown, high immunostaining of β-DG in mdx diaphragm was observed in comparison with TA muscle sections. B: Western blotting of α-DB1, α-SG and β-DG corresponds to total protein extracts of TA (tibialis anterior) and D (diaphragm) muscles. Quantification of protein bands by the NIH Image software package to determine the relative optical density of the protein band (arbitrary unit) is presented under the blots (histograms). The results are mean ± SEM of two independent experiments performed in triplicate. Asterisks denote significant difference (P ≤ 0.05) and NS indicates no significant result with the unpaired t test.
Figure 2
Figure 2. Utrophin distribution in C57BL/10 and mdx diaphragm and Tibialis anterior membrane
A: NMJ viewed by the C-terminal utrophin antibody (images a and c) and fluorescein α-bungarotoxin (images b and d) on serial cryostat sections C57BL/10 diaphragm and Tibialis anterior muscles C57BL/10. B: Utrophin stains on mdx diaphragm and Tibialis anterior muscles with C-terminal (images a and c) and N-terminal (images b and d) antibodies showing the utrophin distribution all along the sarcolemma. Importantly, only C-terminal antibody showed high fiber staining in mdx diaphragm (image a, dashed square).
Figure 3
Figure 3. Up71, Up395 and β-DG expression in mdx diaphragm
A: Western blot detection of utrophin isoforms by C-terminal utrophin antibody. Only the full-length Up395 isoform in mdx TA samples was detected, whereas mdx diaphragm (from 6 to 16 months) presented an additional protein band with Mr 70 kDa (Up71). In addition, a decline in full-length utrophin level was observed while the short isoform Up71 increase during the same time. B: Western blot detection with N-terminal utrophin antibody showed only full-length utrophin Up395 in both mdx diaphragm and TA samples. C: β-DG Western blots in mdx diaphragm extracts from 6- to 16-month-old mice revealed an increase in level up to 12 months. D: RT-PCR analysis of Up71, Up395 and β-DG transcripts. PCR products after cDNA amplification of Up71, Up395 and β-DG of 6- and 12-month-old mdx diaphragm samples revealed the abundance of Up71 and β-DG transcripts at these ages compared with full-length utrophin transcript. Increased expression of Up71 and β-DG was noted between 6- and 12-month-old mdx diaphragms, whereas Up395 was decreased. The 100-pb molecular mass markers (Promega) were used to estimate the molecular mass of the PCR products. Graphical representations show Western blot and PCR band quantification; the results are mean ± SEM of two independent experiments performed in triplicate. Asterisks denote significant difference (P ≤ 0.05).
Figure 4
Figure 4. Co-immunoprecipitation of utrophin isoforms and β-DG
Western blots revealed by C-terminal utrophin and β-DG antibodies in membrane homogenate (Mh) and after co-immunoprecipitation of utrophin products with β-DG (IP-β-DG) respectively in mdx diaphragm (panel A) and Tibialis anterior (panel B) mdx muscles. Panel A showed that Up71 was present in both membrane homogenate (Mh) and eluted fraction of immunoprecipitation assay with β-DG antibody (IP-β-DG). In a second part Mh and eluted fraction were revealed by an antibody directed against β-DG. The same experiments were applied on Tibialis anterior muscle (panel B). No Up71 was detected in Mh and after IP-β-DG.
Figure 5
Figure 5. Utrophin/β-DG accumulation and mdx diaphragm fiber types
A: Relative proportion of diaphragm fiber types in 6- and 12-month-old mdx mice compared with C57BL/10. MHC isoforms were separated on 8% gel electrophoresis and the histogram shows the relative percentages of MHC isoforms of mdx and C57BL/10 diaphragms. B: Serial cross-sections of 12-month-old mdx stained with FITC-MHC I (a), FITC-MHC II (b), Cy3-C-terminal utrophin (c) and Cy3-β-DG antibodies (d). Asterisks show MHC I fibers without specifically high levels of utrophin and/or β-DG in their membranes. Dashed square and white arrowhead show fibers with high expression pattern of utrophin and β-DG in their membranes. C: Serial sections show ATPase activity (pH 4.6) of 12-month-old mdx diaphragm fibers (a), utrophin C-terminal (b) and β-DG antibodies (c). MHC IIa fibers have a milder ATPase activity in acid conditions (pH 4.6) and present an intermediate coloration, while MHC IIb fibers have white coloration. Asterisks show MHC I fibers (a) with a weak labelling of utrophin and β-DG in their membranes. Big arrows show some glycolytic MHC IIb/IIx fibers with a milder level of utrophin and β-DG expression pattern and hatched arrows show fibers with high utrophin and β-DG expression pattern.
Figure 6
Figure 6. Up71 and β-DG accumulation in regenerative/degenerative clusters of mdx diaphragm
A: Serial sections of 12-month-old mdx diaphragm were labeled with desmin antibody revealed with FITC-conjugated antibody (a) and utrophin C-terminal antibody revealed with Cy3-conjugated antibody (b). Desmin labeling showed regenerative fibers (dashed square) with a high level of utrophin. When examined with H&E staining, these aggregate fibers were in majority centro-nucleated (white arrows). B: Western blot detection of MyoD in 6-month-old and 12-month-old mdx diaphragm compared with age-matched (12-month) mdx Tibialis anterior (TA) and C57BL/10 diaphragm.

Similar articles

Cited by

References

    1. Chakkalakal JV, Thompson J, Parks RJ, Jasmin BJ. Molecular, cellular, and pharmacological therapies for duchenne/becker muscular dystrophies. Faseb J. 2005;19:880–91. - PubMed
    1. Ahn AH, Kunkel LM. The structural and functional diversity of dystrophin. Nat Genet. 1993;3:283–91. - PubMed
    1. De Bleecker JL, Engel AG. Expression of cell adhesion molecules in inflammatory myopathies and duchenne dystrophy. J Neuropathol Exp Neurol. 1994;53:369–76. - PubMed
    1. Matsumura K, Campbell KP. Dystrophin-glycoprotein complex: Its role in the molecular pathogenesis of muscular dystrophies. Muscle Nerve. 1994;17:2–15. - PubMed
    1. Higuchi I, Niiyama T, Fukunaga H, Nakamura K, Nakagawa M, Osame M. Dystrophin-related protein in becker muscular dystrophy. Intern Med. 1994;33:334–6. - PubMed

Publication types