A model-based parallel origin and orientation refinement algorithm for cryoTEM and its application to the study of virus structures
- PMID: 16459100
- PMCID: PMC4147871
- DOI: 10.1016/j.jsb.2005.06.009
A model-based parallel origin and orientation refinement algorithm for cryoTEM and its application to the study of virus structures
Abstract
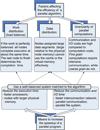
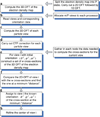
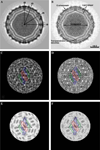
We present a model-based parallel algorithm for origin and orientation refinement for 3D reconstruction in cryoTEM. The algorithm is based upon the Projection Theorem of the Fourier Transform. Rather than projecting the current 3D model and searching for the best match between an experimental view and the calculated projections, the algorithm computes the Discrete Fourier Transform (DFT) of each projection and searches for the central section ("cut") of the 3D DFT that best matches the DFT of the projection. Factors that affect the efficiency of a parallel program are first reviewed and then the performance and limitations of the proposed algorithm are discussed. The parallel program that implements this algorithm, called PO(2)R, has been used for the refinement of several virus structures, including those of the 500 Angstroms diameter dengue virus (to 9.5 Angstroms resolution), the 850 Angstroms mammalian reovirus (to better than 7A), and the 1800 Angstroms paramecium bursaria chlorella virus (to 15 Angstroms).
Figures


Similar articles
-
Rotational and translational alignment errors in 3D reconstruction of virus structures at high resolution.Int J Bioinform Res Appl. 2006;2(4):359-70. doi: 10.1504/IJBRA.2006.011035. Int J Bioinform Res Appl. 2006. PMID: 18048177
-
Low-resolution density maps from atomic models: how stepping "back" can be a step "forward".J Struct Biol. 1999 Apr-May;125(2-3):166-75. doi: 10.1006/jsbi.1999.4093. J Struct Biol. 1999. PMID: 10222272
-
Ab initio random model method facilitates 3D reconstruction of icosahedral particles.J Struct Biol. 2007 Jan;157(1):211-25. doi: 10.1016/j.jsb.2006.07.013. Epub 2006 Aug 11. J Struct Biol. 2007. PMID: 16979906 Free PMC article.
-
Structure determination of macromolecular assemblies by single-particle analysis of cryo-electron micrographs.Curr Opin Struct Biol. 2004 Oct;14(5):584-90. doi: 10.1016/j.sbi.2004.08.004. Curr Opin Struct Biol. 2004. PMID: 15465319 Review.
-
Dissecting Virus Infectious Cycles by Cryo-Electron Microscopy.PLoS Pathog. 2016 Jun 30;12(6):e1005625. doi: 10.1371/journal.ppat.1005625. eCollection 2016 Jun. PLoS Pathog. 2016. PMID: 27362353 Free PMC article. Review. No abstract available.
Cited by
-
Minute virus of mice, a parvovirus, in complex with the Fab fragment of a neutralizing monoclonal antibody.J Virol. 2007 Sep;81(18):9851-8. doi: 10.1128/JVI.00775-07. Epub 2007 Jul 11. J Virol. 2007. PMID: 17626084 Free PMC article.
-
A kinase chaperones hepatitis B virus capsid assembly and captures capsid dynamics in vitro.PLoS Pathog. 2011 Nov;7(11):e1002388. doi: 10.1371/journal.ppat.1002388. Epub 2011 Nov 17. PLoS Pathog. 2011. PMID: 22114561 Free PMC article.
-
AUTO3DEM--an automated and high throughput program for image reconstruction of icosahedral particles.J Struct Biol. 2007 Jan;157(1):73-82. doi: 10.1016/j.jsb.2006.08.007. Epub 2006 Aug 25. J Struct Biol. 2007. PMID: 17029842 Free PMC article.
-
Calcium bridge triggers capsid disassembly in the cell entry process of simian virus 40.J Biol Chem. 2009 Dec 11;284(50):34703-12. doi: 10.1074/jbc.M109.015107. Epub 2009 Oct 12. J Biol Chem. 2009. PMID: 19822519 Free PMC article.
-
Features of reovirus outer capsid protein mu1 revealed by electron cryomicroscopy and image reconstruction of the virion at 7.0 Angstrom resolution.Structure. 2005 Oct;13(10):1545-57. doi: 10.1016/j.str.2005.07.012. Structure. 2005. PMID: 16216585 Free PMC article.
References
-
- Baker TS, Cheng RH. A model-based approach for determining orientations of biological macromolecular electron microscopy. J. Struct. Biol. 1996;116:120–130. - PubMed
-
- Baker TS, Martin IMB, Marinescu DC. A parallel algorithm for determining orientations of biological macromolecules imaged by electron microscopy. Department of Computer Sciences, Purdue University; 1997. CSD-TR #97-055.
-
- Böttcher B, Wynne SA, Crowther RA. Determination of the fold of the core protein of hepatitis B virus by electron cryomicros-copy. Nature (London) 1997;386:88–91. - PubMed
Publication types
MeSH terms
Grants and funding
LinkOut - more resources
Full Text Sources
Other Literature Sources

