Review
. 2006 Apr;35(4):355-67.
doi: 10.1016/j.jcv.2005.12.006. Epub 2006 Feb 7.

Practical experience of high throughput real time PCR in the routine diagnostic virology setting

Affiliations
Review

Practical experience of high throughput real time PCR in the routine diagnostic virology setting

R N Gunson et al. J Clin Virol. 2006 Apr.

Abstract

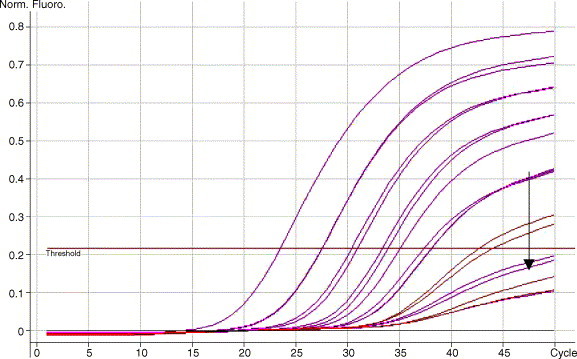
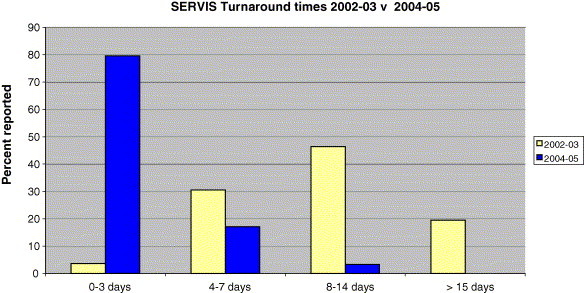
The advent of PCR has transformed the utility of the virus diagnostic laboratory. In comparison to traditional gel based PCR assays, real time PCR offers increased sensitivity and specificity in a rapid format. Over the past 4 years, we have introduced a number of qualitative and quantitative real time PCR assays into our routine testing service. During this period, we have gained substantial experience relating to the development and implementation of real-time assays. Furthermore, we have developed strategies that have allowed us to increase our sample throughput while maintaining or even reducing turn around times. The issues resulting from this experience (some of it bad) are discussed in detail with the aim of informing laboratories that are only just beginning to investigate the potential of this technology.


Figures

Fig. 1
Fig. 1
Molecular beacons contain fluorescent and quenching dyes and are designed to adopt a hairpin structure while free in solution, bringing the fluorescent dye and quencher into close proximity. When a molecular beacon hybridizes to a target, the fluorescent dye and quencher are separated, FRET does not occur, and the fluorescent dye emits light upon irradiation. Unlike dual labelled probes, molecular beacons are designed to remain intact during the amplification reaction (http://probes.invitrogen.com/handbook/figures/0709.html ) .
Fig. 2
Fig. 2
Figure showing assessment of whether real time molecular beacon primers were amplifying the parainfluenza 3 viral RNA. In this reaction, SYBR green was added to the PCR reaction in place of the molecular beacon (all samples negative by molecular beacon assay). The formation of PCR product was observed. Using melt curve analysis, identical melting peaks were observed in all parainfluenza 3 samples and controls (http://probes.invitrogen.com/handbook/figures/0710.html).
Fig. 3
Fig. 3
Dual labelled probes (also known as Taqman™ probes) are oligonucleotides that contain a fluorescent dye on the 5′ base, and a quenching dye located on the 3′ base. When excited the flourescent dye transfers energy to the nearby quenching dye molecule rather than fluorescing, resulting in a non-fluorescent probe. Dual labelled probes are designed to hybridize to an internal region of a PCR product. During PCR, when the polymerase replicates a template on which the probe is bound, the 5′-exonuclease activity of the polymerase cleaves the probe. This separates the fluorescent and quenching dyes and FRET no longer occurs, allowing detection of the signal from the reporter dye. Fluorescence increases in each cycle, proportional to the rate of probe cleavage.
Fig. 4
Fig. 4
Comparison of the ΔRn produced when using dual labelled probes (A) vs. molecular beacons (B).
Fig. 5
Fig. 5
Structure within PCR amplicons may affect the sensitivity of an assay. Respiratory syncitial virus (RSV)-A detection limit is 102 copies/reaction, while RSV-B which is more structured has a detection limit of 104–105 copies per reaction.
Fig. 6
Fig. 6
Contamination of primer and probes with assay target produced at the same facility. Label 1, reaction component: supplier A salt free negative control, mean CT value: 21.08; label 2, reaction component: supplier A salt free positive control (−7), mean CT value: 21.10; label 3, reaction component: supplier A HPLC negative control, mean CT value: 33.28; label 4, reaction component: supplier A HPLC positive control (−7), mean CT value: 30.68; label 5, reaction component: supplier B negative control, mean CT value: 40.00; label 6, reaction component: supplier B positive control (−7), mean CT value: 29.93. A full length DNA oligonucleotide representing the amplicon of a B19 real time PCR assay was synthesised by supplier A. During a later investigation into assay contamination following a reagent change, primers and probes were again purchased from supplier A (salt free and HPLC purified), and from an alternative supplier B. The reagents purchased from supplier B (5 and 6) were clean, whilst those from supplier A (1 + 2) were contaminated with the previously synthesised positive control, even after HPLC purification (3 + 4).
Fig. 7
Fig. 7
Application of Shewart Control Chart to track potential changes in assay performance. The mean CT values obtained for the 1 × 107 copies per ml standard were plotted over time. The average value of these CT values was calculated and plotted (red line) for each data set (along with two standard deviations above (pink line) and below (blue line) the average value). Two standard deviations are generally accepted as the warning level in such analyses. The first ‘jump’ (A) represents a change in the set of standards used, and while this is not ideal, results in a much more reproducible assay. The second jump (B) is caused by a change in the primer–probe pool in use, and shows a significant change in the sensitivity of the assay. As a result of this analysis another batch of primer–probe pool was prepared and the results obtained returned to the acceptable range. For interpretation of the references to colour in this figure legend, the reader is referred to the web version of the article.
Fig. 8
Fig. 8
Example of negative samples showing signal drift. The two sample shown in blue are showing an increases in flourescence when examined using the quantification option (shown above left). Analysis of the raw cycling data (shown above right) shows that there is no increase in flourescence usually associated with a positive sample.
Fig. 9
Fig. 9
An example of a computer placed threshold resulting in false negative readings (arrowed).
Fig. 10
Fig. 10
The turn around time of respiratory samples in 2002–2003 to 2004–2005.

References

    1. Arya M., Shergill I.S., Williamson M., Gommersall L., Arya N., Patel H.R. Basic principles of real time quantitative PCR. Expert Rev Mol Diagn. 2005;5(2):209–219. - PubMed
    1. Aslanzadeh J. Preventing PCR amplification carryover contamination in a clinical laboratory. Ann Clin Lab Sci (Autumn) 2004;34(4):389–396. - PubMed
    1. Bustin S.A., Nolan T. Pitfalls of quantitative real time reverse-transcription polymerase chain reaction. J Biomol Tech. 2004;15(3):155–166. - PMC - PubMed
    1. Davies A.M.C. A coloured version of the J chart or the amc-D J-Chart. Spectroscopy Europe. 2003;15:24–25.
    1. Draganov P., Kulvachev Z. Molecular techniques for detection, identification and analysis of human papillomaviruses (HPVs)] Akush Ginekol (Sofiia) 2004;43(6):38–44. - PubMed