

Analysis of phase of LUCIFERASE expression reveals novel circadian quantitative trait loci in Arabidopsis
- PMID: 16461388
- PMCID: PMC1435814
- DOI: 10.1104/pp.105.074518
Analysis of phase of LUCIFERASE expression reveals novel circadian quantitative trait loci in Arabidopsis
Abstract
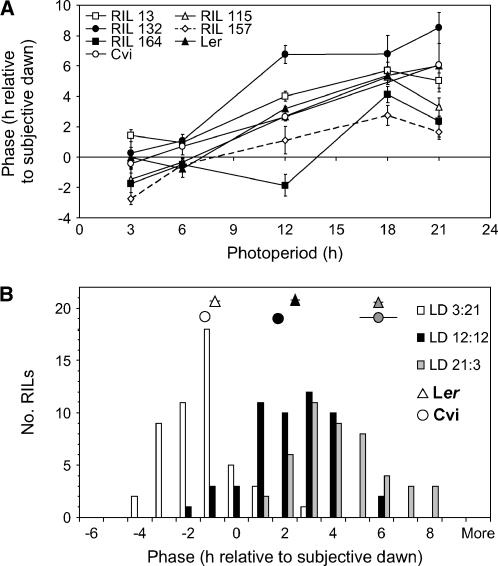
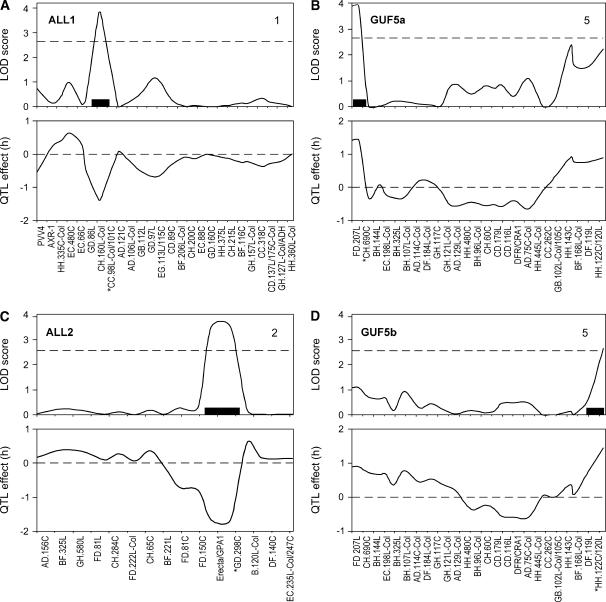
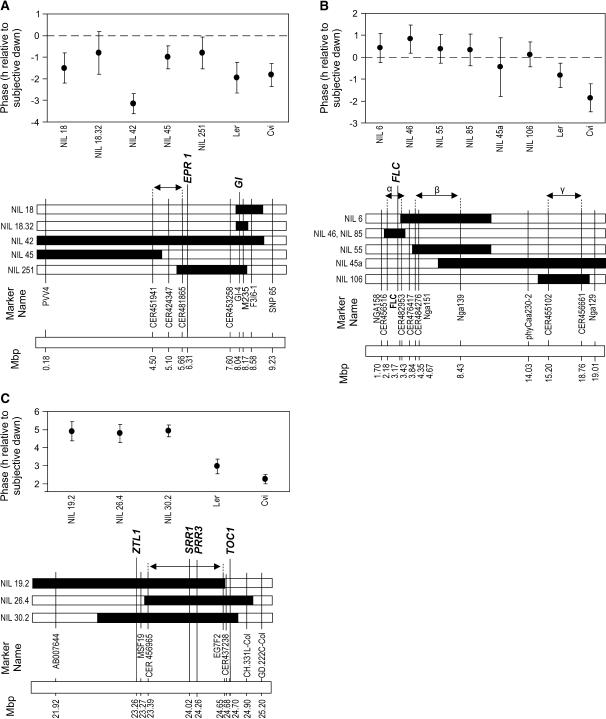
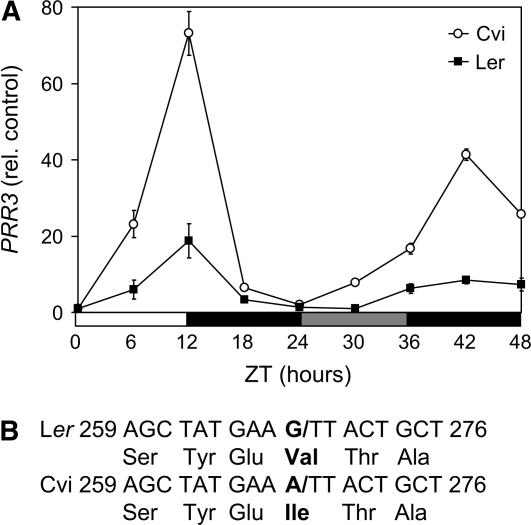
In response to exogenous rhythms of light and temperature, most organisms exhibit endogenous circadian rhythms (i.e. cycles of behavior and gene expression with a periodicity of approximately 24 h). One of the defining characteristics of the circadian clock is its ability to synchronize (entrain) to an environmental rhythm. Entrainment is arguably the most salient feature of the clock in evolutionary terms. Previous quantitative trait studies of circadian characteristics in Arabidopsis (Arabidopsis thaliana) considered leaf movement under constant (free-running) conditions. This study, however, addressed the important circadian parameter of phase, which reflects the entrained relationship between the clock and the external cycle. Here it is shown that, when exposed to the same photoperiod, Arabidopsis accessions differ dramatically in phase. Variation in the timing of circadian LUCIFERASE expression was used to map loci affecting the entrained phase of the clock in a recombinant population derived from two geographically distant accessions, Landsberg erecta and Cape Verde Islands. Four quantitative trait loci (QTL) were found with major effects on circadian phase. A QTL on chromosome 5 contained SIGNALING IN RED LIGHT REDUCED 1 and PSEUDORESPONSE REGULATOR 3, both genes known to affect the circadian clock. Previously unknown polymorphisms were found in both genes, making them candidates for the effect on phase. Fine mapping of two other QTL highlighted genomic regions not previously identified in any circadian screens, indicating their effects are likely due to genes not hitherto considered part of the circadian system.
Figures
Similar articles
-
Natural allelic variation in the temperature-compensation mechanisms of the Arabidopsis thaliana circadian clock.Genetics. 2005 May;170(1):387-400. doi: 10.1534/genetics.104.035238. Epub 2005 Mar 21. Genetics. 2005. PMID: 15781708 Free PMC article.
-
Environmental memory from a circadian oscillator: the Arabidopsis thaliana clock differentially integrates perception of photic vs. thermal entrainment.Genetics. 2011 Oct;189(2):655-64. doi: 10.1534/genetics.111.131417. Epub 2011 Aug 11. Genetics. 2011. PMID: 21840862 Free PMC article.
-
QTL Underlying Circadian Clock Parameters Under Seasonally Variable Field Settings in Arabidopsis thaliana.G3 (Bethesda). 2019 Apr 9;9(4):1131-1139. doi: 10.1534/g3.118.200770. G3 (Bethesda). 2019. PMID: 30755409 Free PMC article.
-
An overview of natural variation studies in the Arabidopsis thaliana circadian clock.Semin Cell Dev Biol. 2013 May;24(5):422-9. doi: 10.1016/j.semcdb.2013.03.006. Epub 2013 Apr 1. Semin Cell Dev Biol. 2013. PMID: 23558216 Review.
-
From a repressilator-based circadian clock mechanism to an external coincidence model responsible for photoperiod and temperature control of plant architecture in Arabodopsis thaliana.Biosci Biotechnol Biochem. 2013;77(1):10-6. doi: 10.1271/bbb.120765. Epub 2013 Jan 7. Biosci Biotechnol Biochem. 2013. PMID: 23291766 Review.
Cited by
-
Natural diversity in daily rhythms of gene expression contributes to phenotypic variation.Proc Natl Acad Sci U S A. 2015 Jan 20;112(3):905-10. doi: 10.1073/pnas.1422242112. Epub 2014 Dec 29. Proc Natl Acad Sci U S A. 2015. PMID: 25548158 Free PMC article.
-
Quantitative trait loci for the circadian clock in Neurospora crassa.Genetics. 2007 Dec;177(4):2335-47. doi: 10.1534/genetics.107.077958. Epub 2007 Oct 18. Genetics. 2007. PMID: 17947430 Free PMC article.
-
Reflections on Several Landmark Advances in Circadian Biology.J Circadian Rhythms. 2024 Apr 1;22:1. doi: 10.5334/jcr.236. eCollection 2024. J Circadian Rhythms. 2024. PMID: 38617711 Free PMC article. Review.
-
Differential expression of genes important for adaptation in Capsella bursa-pastoris (Brassicaceae).Plant Physiol. 2007 Sep;145(1):160-73. doi: 10.1104/pp.107.102632. Epub 2007 Jul 13. Plant Physiol. 2007. PMID: 17631524 Free PMC article.
-
Rapid assessment of gene function in the circadian clock using artificial microRNA in Arabidopsis mesophyll protoplasts.Plant Physiol. 2010 Oct;154(2):611-21. doi: 10.1104/pp.110.162271. Epub 2010 Aug 13. Plant Physiol. 2010. PMID: 20709829 Free PMC article.
References
-
- Alonso-Blanco C, Peeters AJM, Koornneef M, Lister C, Dean C, van den Bosch N, Pot J, Kuiper MTR (1998. b) Development of an AFLP based linkage map of Ler, Col and Cvi Arabidopsis thaliana ecotypes and construction of a Ler/Cvi recombinant inbred line population. Plant J 14: 259–271 - PubMed
-
- Brown PE (2004) BRASS—Biological Rhythms Analysis Software System Version 1.3.1. http://www.amillar.org/Downloads.html (February 11, 2004)
Publication types
MeSH terms
Substances
Associated data
- Actions
- Actions
- Actions
- Actions
Grants and funding
LinkOut - more resources
Full Text Sources
Molecular Biology Databases
