. 2006 May 1;90(9):3288-99.
doi: 10.1529/biophysj.105.072819. Epub 2006 Feb 3.

Zero mode waveguides for single-molecule spectroscopy on lipid membranes

Affiliations

Zero mode waveguides for single-molecule spectroscopy on lipid membranes

K T Samiee et al. Biophys J. .

Abstract

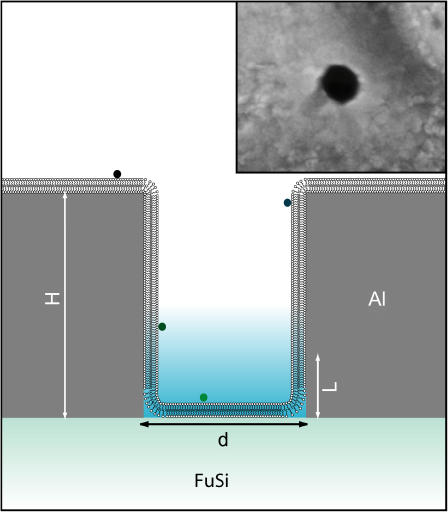
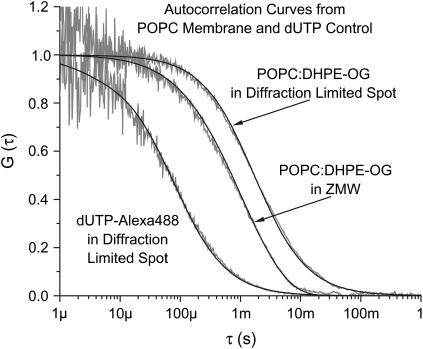
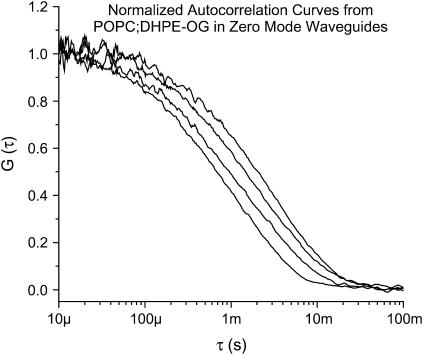
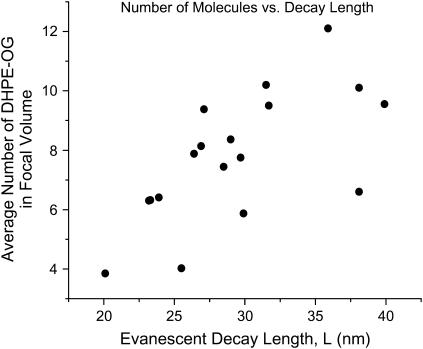
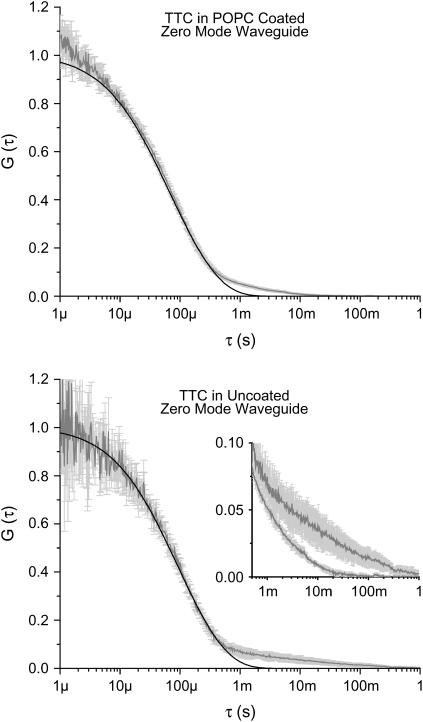
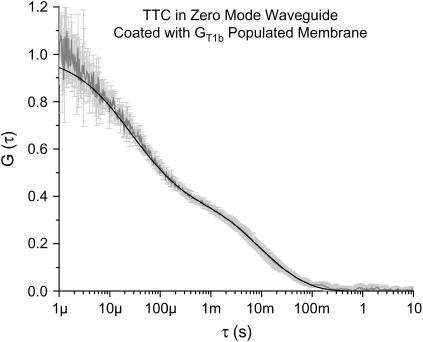
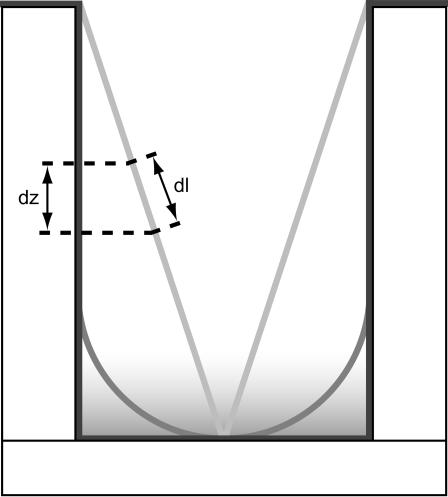
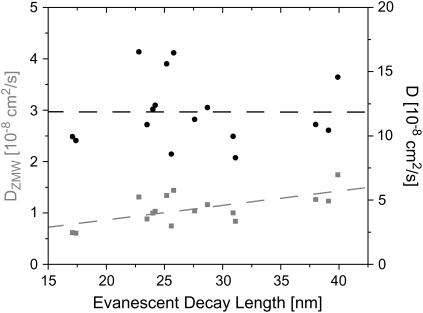
Zero mode waveguides (ZMWs), subwavelength optical nanostructures with dimensions ranging from 50 to 200 nm, have been used to study systems involving ligand-receptor interactions. We show that under proper conditions, lipid membranes will invaginate into the nanostructures, which confine optical excitation to subattoliter volumes. Fluorescence correlation spectroscopy (FCS) was used to characterize the diffusion of fluorescently tagged lipids in liquid-disordered phase 1-palmitoyl-2-oleoyl-sn-glycero-3-phosphocholine (POPC) and gel phase 1,2-distearoyl-sn-glycero-3-phosphocholine (DSPC) membranes incubated on the nanostructured surface. In contrast to the POPC, DSPC membranes did not appear to enter the structures, suggesting that invagination is dependent on membrane rigidity. Although correlation curves obtained from POPC membranes conformed to previously derived models for diffusion in the evanescent field within the nanostructure, the diffusion constants obtained were systematically lower than expected. The validity of the one-dimensional diffusion model for membrane diffusion is discussed and it is concluded that the erroneous diffusion constants are a result of nontrivial membrane conformation within the ZMWs. Additionally, FCS was used to characterize the fraction of fluorescently labeled tetanus toxin C fragment bound to a ganglioside-populated POPC membrane within the ZMWs. This allowed the determination of the toxin's equilibrium binding constant at a concentration of 500 nM; higher than possible with diffraction-limited FCS. To our knowledge, the results presented here are the first reported for supported lipid bilayers in nanostructured devices. Furthermore, they open the possibility of studying membrane imbedded receptors and proteins at physiological concentrations with single-molecule resolution.


Figures

FIGURE 1
FIGURE 1
Lipid bilayer membranes are thought to coat the surface of the zero mode waveguides. The structures are characterized by a diameter, typically between 50 and 200 nm; a height, ∼100 nm; and a characteristic evanescent decay length that ranges from 15 nm for small structures to more than 35 nm for larger ones. These experiments used fluorescently labeled lipid DHPE-Oregon Green and tetanus toxin-Alexa488 as fluorescent probes. The fluorophores are only excited and detected when near the bottom of the structure, in the evanescent field, providing a focal volume on the order of a few tens of zeptoliters. The zero mode waveguides are illuminated from the bottom by a microscope in epi-illumination mode. (Inset) Scanning electron micrograph of a zero mode waveguide.
FIGURE 2
FIGURE 2
Normalized autocorrelation curves from POPC/DHPE-OG and dUTP-Alexa488 in bulk and POPC/DHPE-OG in a ZMW. Curves are shaded with fits shown in black. (Left to right) dUTP-Alexa in a diffraction-limited volume, POPC/DHPE-OG in a zero mode waveguide and POPC/DHPE-OG in a diffraction-limited volume. A three-dimensional FCS model including a triplet component was used for the dUTP curve. The POPC curves were fit using the ZMW model or a two-dimensional FCS model as appropriate.
FIGURE 3
FIGURE 3
Normalized autocorrelation curves from POPC/DHPE-OG bilayers in ZMWs. The radius of the structure dictates the length of the evanescent decay and hence the diffusion time. Here, curves from four structures of different sizes are plotted showing the shift in diffusion time resulting from the differing evanescent decay lengths.
FIGURE 4
FIGURE 4
Average number of DHPE-Oregon Green molecules in several ZMWs was determined by fitting the autocorrelation functions. This number is plotted against the evanescent decay parameter. Each point represents one fit. Larger focal volumes admit larger membrane areas and hence more DHPE-OG molecules. As a result, the apparent upward trend is expected. The deviation from a linear relationship is probably due to the membrane's finite flexibility. Small differences in ZMW shape or surface chemistry may have caused incomplete invagination into the structures.
FIGURE 5
FIGURE 5
Normalized autocorrelation curves from fluorescently labeled tetanus toxin in zero mode waveguides. The shaded line represents the average of 5 curves, and error bars indicate the standard deviation at each point. The solid line is a fit with a ZMW model; which does not account for surface interactions. Because the surface interactions are not treated by the model, the parameters extracted from the fits are somewhat distorted. (Top) From waveguides coated with POPC. The “foot”, where the autocorrelation data deviate from the model, is due to a nonspecific or pseudospecific interaction between the protein and lipid membrane. The nature of the interaction between the tetanus and POPC is not known, however (see the text). (Bottom) From untreated waveguides. The foot at the bottom of the curve is due to fluorescent protein adsorbing to the glass and alumina surfaces and photobleaching. The large variation in the foot is consistent with physical adsorption. Note that the adsorption component from the uncoated structures has a characteristic time an order of magnitude longer than from the POPC-coated structures. (Inset) The long time tails of both curves plotted together.
FIGURE 6
FIGURE 6
Autocorrelation curve from fluorescently labeled tetanus toxin incubated in a waveguide coated with GT1b-populated POPC. The shaded curve is the average of five curves. The error bars represent the standard deviation at each point. The solid line is a fit from a zero mode waveguide model accounting for two distinct diffusing species. The fast component is the freely diffusing TTC, whereas the slow component is from TTC bound to the gangliosides. The equilibrium binding constant can be obtained from the fraction of bound toxin and the total tetanus concentration.
FIGURE 7
FIGURE 7
Lipid membranes may take on a number of conformations within the ZMWs. Shown here are three of those: (Dark shaded) The membrane coats the surface perfectly. (Shaded) The membrane takes on the cylindrical shape of the ZMW near the top but ends in a hemispherical cap. The membrane shown here has a radius of curvature equal to the radius of the ZMW. (Light shaded) A conical membrane. The membrane shape can influence the measurement of diffusion constants. As fluorophores travel a distance dl on the membrane, they move only a smaller distance dz in the axial direction. Because the spatial detectivity function in the ZMWs only changes in the axial direction, only movement in the axial direction can be detected experimentally. This results in the fluorophores appearing to move more slowly than they actually are, and hence, a depressed estimate of the diffusion constant.
FIGURE 8
FIGURE 8
A representative set of diffusion constants obtained by fitting FCS autocorrelation functions with the one-dimensional model (shaded squares). The estimate of the diffusion constant clearly depends on the evanescent decay length of the ZMW and hence on the size of the ZMW. The dashed line is a linear fit of the data. Past experiments, with fluorophores not confined to a membrane, have not displayed this dependence of D on L. When the conformation of the membrane in the ZMWs is accounted for, the correction of the estimated diffusion constant removes this dependence and produces a diffusion constant closer to accepted values. Solid circles represent the data corrected, assuming a membrane with a spherical cap of radius 50 nm at the bottom of the ZMWs.
FIGURE 9
FIGURE 9
Correction factor plotted as a function of evanescent decay length. Each line corresponds to a membrane with the labeled radius of curvature. As expected, the correction is largest for structures with short evanescent decay length and hence small radii.
FIGURE 10
FIGURE 10
Relative standard deviation of the corrected POPC/DHPE-OG and POPC/GT1b/DHPE-OG diffusivities as a function of the membrane's radius of curvature at the bottom of the ZMW. The relative standard deviation of the uncorrected data is high because there is a slope to the diffusivity when plotted as a function of L. As that dependence is removed by the correction of the data, the relative standard deviation decreases. The minimum is expected to occur near where the diffusion constant's dependence on L is removed completely. For the POPC membrane, that minimum occurs for a radius of curvature of 50 nm. In contrast, the more rigid POPC/GT1b membrane reaches a minimum for a larger radii of curvature, suggesting that the membrane is taking the minimum allowable curvature within the structure.

References

    1. Lipowsky, R. 1995. The morphology of lipid membranes. Curr. Opin. Struct. Biol. 5:531–540. - PubMed
    1. Lipowsky, R. 1995. From bunches of membranes to bundles of strings. Zeitschrift Fur Physik B-Condensed Matter. 97:193–203.
    1. Lipowsky, R., and S. Leibler. 1986. Unbinding transitions of interacting membranes. Phys. Rev. Lett. 56:2541–2544. - PubMed
    1. Mutz, M., and W. Helfrich. 1989. Unbinding transition of a biological model membrane. Phys. Rev. Lett. 62:2881–2884. - PubMed
    1. Lipowsky, R. 1994. Discontinuous unbinding transitions of flexible membranes. Journal De Physique Ii. 4:1755–1762.

LinkOut - more resources