Comparative Study
. 2006 May 1;90(9):3062-73.
doi: 10.1529/biophysj.105.076075. Epub 2006 Feb 3.

A protein dynamics study of photosystem II: the effects of protein conformation on reaction center function

Affiliations
Comparative Study

A protein dynamics study of photosystem II: the effects of protein conformation on reaction center function

Sergej Vasil'ev et al. Biophys J. .

Abstract

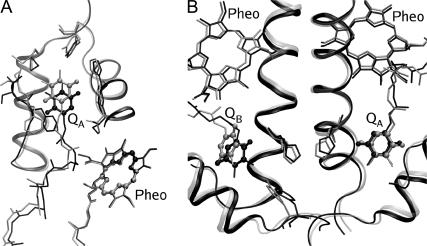
Molecular dynamics simulations have been performed to study photosystem II structure and function. Structural information obtained from simulations was combined with ab initio computations of chromophore excited states. In contrast to calculations based on the x-ray structure, the molecular-dynamics-based calculations accurately predicted the experimental absorbance spectrum. In addition, our calculations correctly assigned the energy levels of reaction-center (RC) chromophores, as well as the lowest-energy antenna chlorophyll. The primary and secondary quinone electron acceptors, Q(A) and Q(B), exhibited independent changes in position over the duration of the simulation. Q(B) fluctuated between two binding sites similar to the proximal and distal sites previously observed in light- and dark-adapted RC from purple bacteria. Kinetic models were used to characterize the relative influence of chromophore geometry, site energies, and electron transport rates on RC efficiency. The fluctuating energy levels of antenna chromophores had a larger impact on quantum yield than did their relative positions. Variations in electron transport rates had the most significant effect and were sufficient to explain the experimentally observed multi-component decay of excitation in photosystem II. The implications of our results are discussed in the context of competing evolutionary selection pressures for RC structure and function.


Figures

FIGURE 1
FIGURE 1
Equilibrated simulation system. (A) View from the stromal side of the membrane. (B) View along the plane of the lipid bilayer (stromal surface above). Chlorophylls are shown in green (only macrocycle atoms are shown for clarity) and β-carotene molecules are orange. Lipids filling gaps in the x-ray structure are white. Protein backbone of CP43 and CP47 is blue, backbone of D1 and D2 proteins is yellow, and other subunits are pink. Sodium and phosphate ions are orange and blue, respectively. Oxygen-evolving complex is purple.
FIGURE 2
FIGURE 2
Time dependence of the root-mean-square deviations of PSII chromophore positions. The first frame of the molecular trajectory (roughly equivalent to the x-ray structure) was used as a reference. RMSD were calculated independently for three different regions in the structure, the RC (D1/D2), CP43, and CP47. RMSD was also calculated for all PSII core chromophores together, and is shown in the bottom panel.
FIGURE 3
FIGURE 3
Experimental (thick solid line) and simulated absorbance spectra of the PSII core complex. See Methods for details on the quantum mechanical spectral simulations. The spectrum simulated using the x-ray coordinates from 1S5L is shown by the long dashed line. Spectra simulated using four different frames from the MD trajectory, separated by 1 ns, are shown by the dotted lines. The thin solid black line represents the average of the four MD simulated spectra.
FIGURE 4
FIGURE 4
Energy levels of the QY transitions of all PSII chromophores. The average energies obtained at four different times separated by 1 ns are shown along with the standard deviation. Chromophores are sorted by pigment number in such a way that symmetry-related chromophores in CP43 and CP47 have the same number on the x axis. The table on the left correlates the pigment number with the chromophore numbers from the 1S5L PDB structure file.
FIGURE 5
FIGURE 5
Time dependence of chromophore separation distances and mean excited-state lifetime of the PSII core complex. (A) Distance between CP43 Chl14 and D1 Pheo (black line) and the distance between CP47 Chl31 and D2 Pheo (gray line). (B) Calculated mean excited-state lifetime (see Methods for details).
FIGURE 6
FIGURE 6
Two representative conformations of the PSII core, taken from the MD simulation, showing fluctuations in the distances between electron-transfer cofactors. (A) Variation of the distance between QA and Pheo. (B) Variation of the distance between QA and QB.
FIGURE 7
FIGURE 7
Time dependences of the edge-to-edge distance between electron-transfer cofactors. (A) Fluctuating distance between Pheo D1 and QA (upper trace) and the calculated rate of electron transfer between them (lower trace). The average rate was 6 ns−1. (B) Histogram of the rate distribution determined from the rates presented in A. (C) Time dependence of the edge-to-edge distance between QA and QB (upper trace) and the calculated rate of electron transfer between them (lower trace). The average rate was 3.5 μs−1. (D) Histogram of the rate distribution determined from the rates presented in C. The rates of electron transfer were calculated using “Dutton's ruler”, as described in Methods.

References

    1. Michel, H., and J. Deisenhofer. 1988. Relevance of the photosynthetic reaction center from purple bacteria to the structure of photosystem II. Biochemistry. 27:1–7.
    1. Barber, J., and B. Andersson. 1994. Revealing the blueprint of photosynthesis. Nature. 370:31–34.
    1. Rhee, K. H., E. P. Morris, J. Barber, and W. Kuhlbrandt. 1998. Three-dimensional structure of the plant photosystem II reaction centre at 8 Å resolution. Nature. 396:283–286. - PubMed
    1. Schubert, W.-D., O. Klukas, W. Saenger, H.-T. Witt, P. Fromme, and N. Krauß. 1998. A common ancestor for oxygenic and anoxygenic photosynthetic systems: a comparison based on the structural model pf photosystem I. J. Mol. Biol. 280:297–314. - PubMed
    1. Barber, J. 2003. Photosystem II: the engine of life. Q. Rev. Biophys. 36:71–89. - PubMed

Publication types

MeSH terms

Substances

LinkOut - more resources