. 2006 Feb 14;103(7):2257-61.
doi: 10.1073/pnas.0510565103. Epub 2006 Feb 3.

A microRNA expression signature of human solid tumors defines cancer gene targets

Affiliations

A microRNA expression signature of human solid tumors defines cancer gene targets

Stefano Volinia et al. Proc Natl Acad Sci U S A. .

Abstract

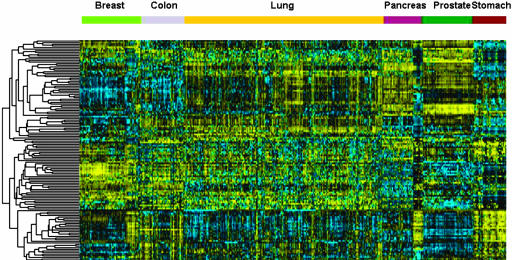
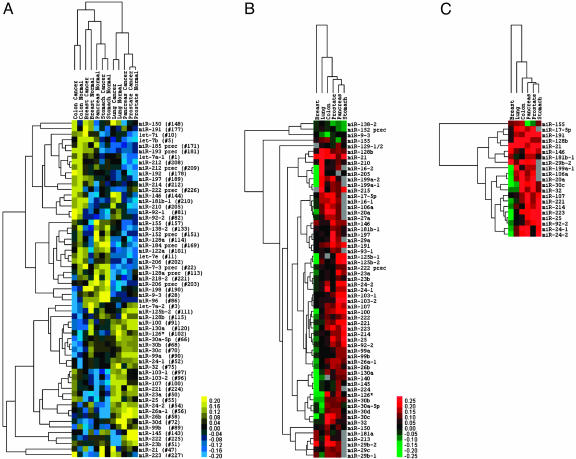
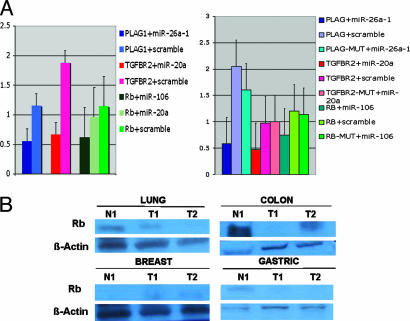
Small noncoding microRNAs (miRNAs) can contribute to cancer development and progression and are differentially expressed in normal tissues and cancers. From a large-scale miRnome analysis on 540 samples including lung, breast, stomach, prostate, colon, and pancreatic tumors, we identified a solid cancer miRNA signature composed by a large portion of overexpressed miRNAs. Among these miRNAs are some with well characterized cancer association, such as miR-17-5p, miR-20a, miR-21, miR-92, miR-106a, and miR-155. The predicted targets for the differentially expressed miRNAs are significantly enriched for protein-coding tumor suppressors and oncogenes (P < 0.0001). A number of the predicted targets, including the tumor suppressors RB1 (Retinoblastoma 1) and TGFBR2 (transforming growth factor, beta receptor II) genes were confirmed experimentally. Our results indicate that miRNAs are extensively involved in cancer pathogenesis of solid tumors and support their function as either dominant or recessive cancer genes.


Conflict of interest statement

Conflict of interest statement: No conflicts declared.

Figures

Fig. 1.
Fig. 1.
Clustering analysis of 540 samples representing six solid cancers and the respective normal tissues. MiRNAs were included in the tree when their expression level (background-subtracted intensity) was higher than the threshold value (256) in at least 90% of the samples. One hundred thirty-seven miRNAs were retained for clustering. Arrays were median-centered and normalized by using gene cluster 2.0. Average linkage clustering was performed by using uncentered correlation metric.
Fig. 2.
Fig. 2.
miRNA expression signature in six solid cancers. (A) Expression of the differentially regulated miRNAs across solid cancers. Sixty-one miRNAs are present in at least 90% of the tissues. The tree displays their average absolute expression values after log2 transformation. The mean was computed over all samples from the same tissue or tumor histotype. Genes and arrays were mean-centered and normalized by using gene cluster 2.0. Average linkage clustering was performed by using Euclidean distance. (B) Fold changes (cancer vs. normal) of the miRNAs present in at least 75% of the solid tumors with at least one tumor absolute value higher than 2. The tree displays the log2 transformation of the average fold changes (cancer over normal). The mean was computed over all samples from the same tissue or tumor histotype. Arrays were mean centered and normalized by using gene cluster 2.0. Average linkage clustering was performed by using uncentered correlation metric. (C) Fold changes (cancer vs. normal) of the miRNAs present in the signatures of at least 50% of the solid tumors. The tree displays the log2 transformation of the average fold changes (cancer over normal). The mean was computed over all samples from the same tissue or tumor histotype. Arrays were mean centered and normalized by using gene cluster 2.0. Average linkage clustering was performed by using uncentered correlation metric.
Fig. 3.
Fig. 3.
Protein-coding cancer genes as targets of solid cancer miRNA signature components. (A) The 3′ UTR of different cancer protein coding genes enable cancer miRNA regulation. The data present the relative repression of firefly luciferase expression standardized to a transfection control, renilla luciferase. The miRNAs were selected from those differentially regulated in solid cancers as shown in Fig. 2 and Table 2. PLAG1, pleiomorphic adenoma gene 1; TGFBR2, transforming growth factor, beta receptor II, Rb, retinoblastoma gene. pGL-3 (Promega) was used as the empty vector. miR-20a, miR-26a-1, and miR-106 oligoRNAs (sense and scrambled) were used for transfections. A second experiment using as control a mutated version of each target mRNA lacking the 5′ miRNA-end complementarity site (MUT) is shown at Right. All of the experiments were performed twice in triplicate (n = 6). (B) In cancer patients, the levels of RB1 protein correspond to an inversely correlation with miR-106a expression. For normalization, we used β actin.

References

    1. Ambros V. Cell. 2003;113:673–676. - PubMed
    1. Cullen B. R. Mol. Cell. 2004;16:861–865. - PubMed
    1. Bartel D. P. Cell. 2004;116:281–297. - PubMed
    1. Calin G. A., Dumitru C. D., Shimizu M., Bichi R., Zupo S., Noch E., Aldler H., Rattan S., Keating M., Rai K., et al. Proc. Natl. Acad. Sci. USA. 2002;99:15524–15529. - PMC - PubMed
    1. Michael M. Z., SM O. C., van Holst Pellekaan N. G., Young G. P., James R. J. Mol. Cancer Res. 2003;1:882–891. - PubMed

Publication types