. 2006 Feb 14;103(7):2015-20.
doi: 10.1073/pnas.0510525103. Epub 2006 Feb 3.

The role of the airline transportation network in the prediction and predictability of global epidemics

Affiliations

The role of the airline transportation network in the prediction and predictability of global epidemics

Vittoria Colizza et al. Proc Natl Acad Sci U S A. .

Abstract

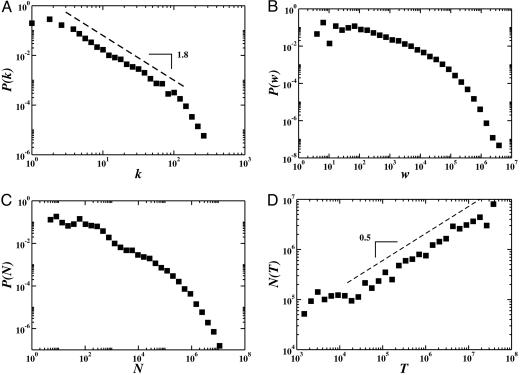
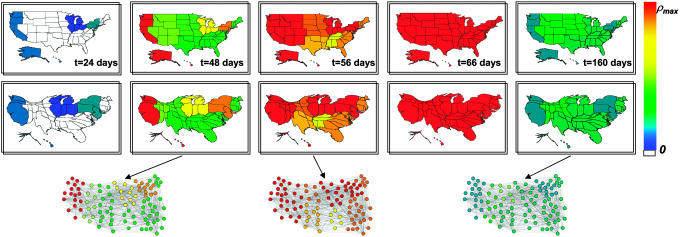
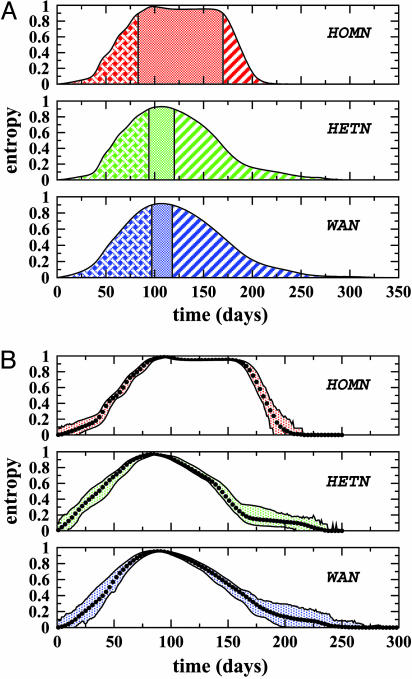
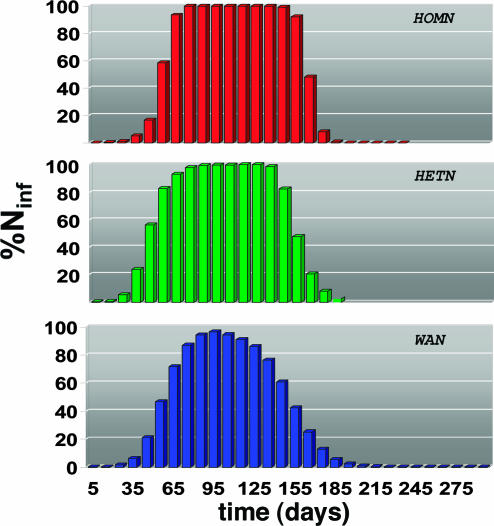
The systematic study of large-scale networks has unveiled the ubiquitous presence of connectivity patterns characterized by large-scale heterogeneities and unbounded statistical fluctuations. These features affect dramatically the behavior of the diffusion processes occurring on networks, determining the ensuing statistical properties of their evolution pattern and dynamics. In this article, we present a stochastic computational framework for the forecast of global epidemics that considers the complete worldwide air travel infrastructure complemented with census population data. We address two basic issues in global epidemic modeling: (i) we study the role of the large scale properties of the airline transportation network in determining the global diffusion pattern of emerging diseases; and (ii) we evaluate the reliability of forecasts and outbreak scenarios with respect to the intrinsic stochasticity of disease transmission and traffic flows. To address these issues we define a set of quantitative measures able to characterize the level of heterogeneity and predictability of the epidemic pattern. These measures may be used for the analysis of containment policies and epidemic risk assessment.


Conflict of interest statement

Conflict of interest statement: No conflicts declared.

Figures

Fig. 1.
Fig. 1.
Properties of the worldwide airport network. Statistical fluctuations are observed over a broad range of length scales. (A) The degree distribution P(k) follows a power-law behavior on almost two decades with exponent 18 ± 0.2. (B) The distribution of the weights (fluxes) is skewed and heavy-tailed. (C) The distribution of populations is heavy-tailed distributed, in agreement with the commonly observed Zipf’s law (25). (D) The city population varies with the traffic of the corresponding airport as NTα with α ≅ 0.5, in contrast with the linear behavior postulated in previous works (22).
Fig. 2.
Fig. 2.
Geographical representation of the disease evolution in the United States for an epidemics starting in Hong Kong based on a SIR dynamics within each city. States are collected according to the nine influenza surveillance regions. The color code corresponds to the prevalence in each region, from 0to the maximum value reached (ρmax). In the top row, the original United States maps are shown, and in the bottom are provided the corresponding cartograms obtained by rescaling each region according to its population. Three representations of the airport network restricted to the United States are also shown, in correspondence to the three different snapshots. The nodes represent the 100airports in the United States with highest traffic T; the color is assigned in accordance to the color code adopted for the maps.
Fig. 3.
Fig. 3.
Analysis of the heterogeneity of the epidemic pattern in the actual network (WAN) compared with the two network models (HOMN and HETN). A SIR dynamics is adopted within each city. (A) Entropy H(t) averaged over distinct initial infected cities and over noise realizations. Each profile is divided into three different phases, the central one corresponding to H > 0.9; i.e., to a homogeneous geographical spread of the disease. This phase is much longer for the HOMN than for the real airport network. The behavior observed in HETN is close to the real case meaning that the connectivity pattern plays a leading role in the epidemic behavior. (B) Average value of the entropy, with the maximal dispersion obtained from 2·102 noise realizations of an epidemics starting in Hong Kong. Fluctuations have a mild effect in all cases.
Fig. 4.
Fig. 4.
Percentage of infected cities as a function of time for an epidemics starting in Hong Kong based on a SIR dynamics within each city. The HOMN case displays a large interval in which all cities are infected. The HETN and the real case show a smoother profile with long tails, signature of a long lasting geographical heterogeneity of the epidemic diffusion.
Fig. 5.
Fig. 5.
Percentage of overlap as a function of time. The shaded area corresponds to the standard deviation obtained with 5·103 couples of different realizations of the global spreading model based on a SIR dynamics within each city. Topological heterogeneity plays a dominant role in reducing the overlap in the early stage of the epidemics. We observe two different behaviors depending on the degree of the initially infected city: a reduced initial predictability in the case of airport hubs (Left) with respect to poorly connected cities (Right). Large fluctuations at the end of the epidemics are observed in the HETN and in the real case, due to the different lifetime of the epidemics in distinct realizations induced by the heterogeneity of the network. We also report the prevalence profile as a function of time showing that the maximum predictability corresponds to a prevalence peak.

References

    1. Anderson R. M., May R. M. Infectious Diseases in Humans. Oxford: Oxford Univ. Press; 1992.
    1. Hethcote H. W., Yorke J. A. Lect. Notes Biomath. 1984;56:1–105.
    1. Kretzschmar M., Morris M. Math. Biosci. 1996;133:165–195. - PubMed
    1. Keeling M. Proc. R. Soc. London Ser. B; 1999. pp. 859–867. - PubMed
    1. Pastor-Satorras R., Vespignani A. Phys. Rev. Lett. 2001;86:3200–3203. - PubMed