. 2006 Feb;72(2):1476-86.
doi: 10.1128/AEM.72.2.1476-1486.2006.

Degradation of 4-chloro-2-methylphenoxyacetic acid in top- and subsoil is quantitatively linked to the class III tfdA gene

Affiliations

Degradation of 4-chloro-2-methylphenoxyacetic acid in top- and subsoil is quantitatively linked to the class III tfdA gene

Jacob Baelum et al. Appl Environ Microbiol. 2006 Feb.

Erratum in

  • Appl Environ Microbiol. 2006 May;72(5):3803

Abstract

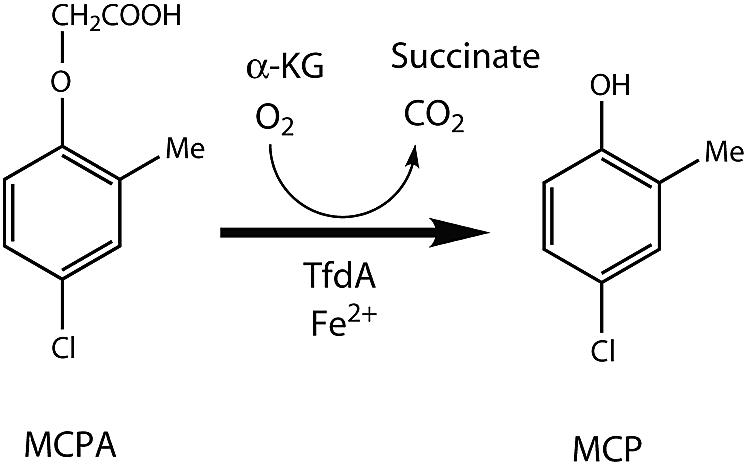
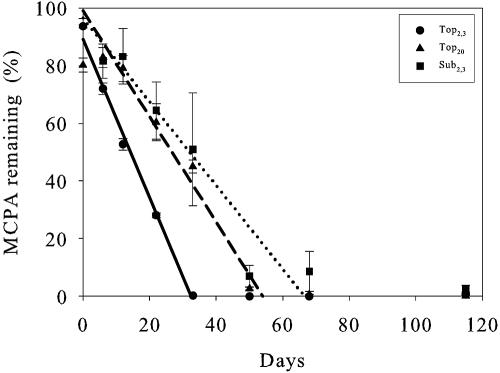
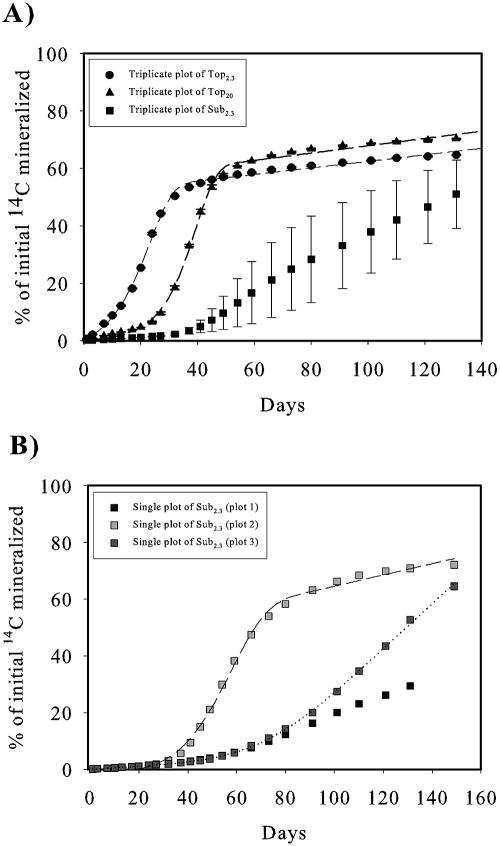
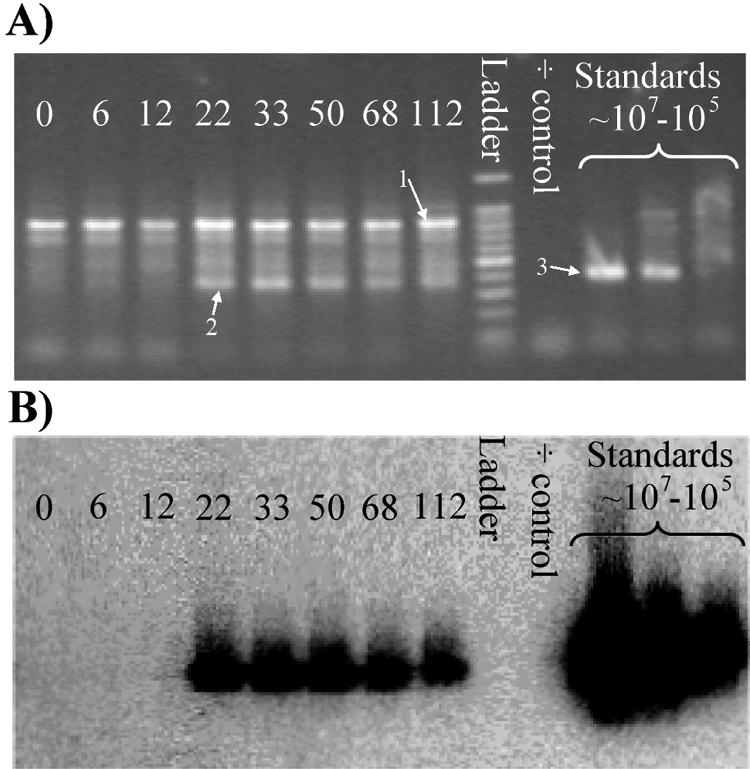
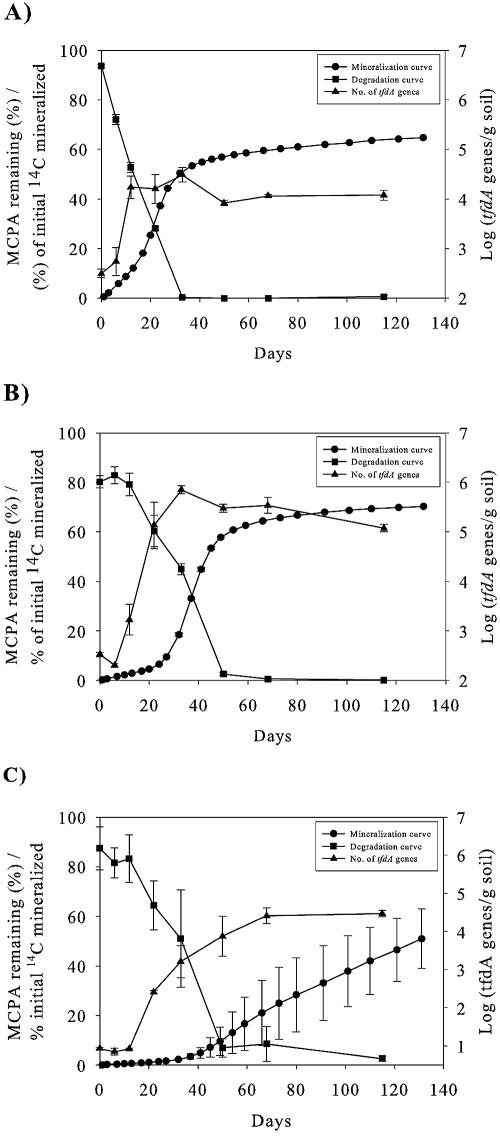
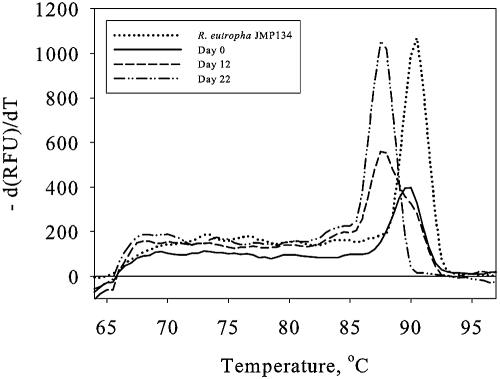
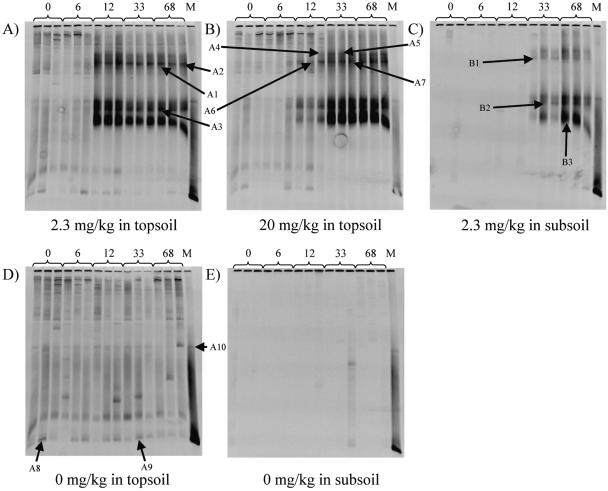
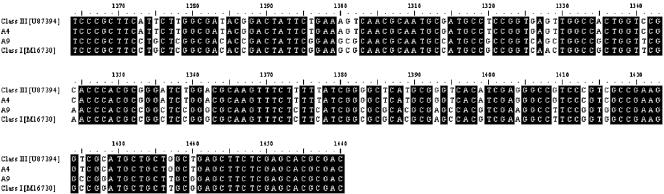
The tfdA gene is known to be involved in the first step of the degradation of the phenoxy acid herbicide 4-chloro-2-methylphenoxyacetic acid (MCPA) in several soil bacteria, but bacteria containing other tfdA-like genes have been isolated as well. A quantitative real-time PCR method was used to monitor the increase in the concentration of tfdA genes during degradation of MCPA in sandy topsoil and subsoil over a period of 115 days. Quantitative PCR revealed growth in the tfdA-containing bacterial community, from 500 genes g(-1) soil to approximately 3 x 10(4) genes g(-1) soil and to 7 x 10(5) genes g(-1) soil for topsoil initially added to 2.3 mg MCPA kg(-1) (dry weight) soil and 20 mg MCPA kg(-1) (dry weight) soil, respectively. We analyzed the diversity of the tfdA gene during the degradation experiment. Analyses of melting curves of real-time PCR amplification products showed that a shift in the dominant tfdA population structure occurred during the degradation period. Further denaturing gradient gel electrophoresis and sequence analysis revealed that the tfdA genes responsible for the degradation of MCPA belonged to the class III tfdA genes, while the tfdA genes present in the soil before the occurrence of degradation belonged to the class I tfdA genes. The implications of these results is that the initial assessment of functional genes in soils does not necessarily reflect the organisms or genes that would carry out the degradation of the compounds in question.


Figures

FIG. 1.
FIG. 1.
Catabolic activity of the TfdA enzyme in the degradation of MCPA. α-KG, α-ketoglutarate.
FIG. 2.
FIG. 2.
Degradation of MCPA in the three soil scenarios measured by LC-MS/MS. Linear regression lines of the steep segments are shown. Solid line, Top2.3; dashed line, Top20; dotted line, Sub2.3. Error bars indicate standard errors.
FIG. 3.
FIG. 3.
Mineralization of 14C-MCPA in the three soil scenarios. (A) Curves show triplicate cumulative data from Top2.3, Top20, and Sub2.3. The dashed line shows a nonlinear fit to the exponential form of the 3/2-order model. Due to the large standard deviation, the plot of the triplicates for Sub2.3 was not fitted. (B) Single plots of the Sub2.3 replicates. The dotted line shows nonlinear fits to the linear form of 3/2-order model, and the dashed line shows a nonlinear fit to the exponential form of the 3/2-order model (plots 2 and 3). Plot 1 was not satisfactorily fitted to any model. Error bars in A indicate standard errors.
FIG. 4.
FIG. 4.
Primer optimization. (A) Standard agarose gel electrophoresis of real-time PCR amplification products using the tfdA* primer; the iQ SYBR green supermix and soil DNA from days 0, 6, 12, 33, 50, 68, and 115 of Top20 were used as a template. The standard is R. eutropha JMP134 inoculated into the soil in concentrations of 8 × 10⁶, 8 × 10⁵, and 8 × 10⁴ cells/g soil, with 8 × 10⁶ cells/g soil shown to the left. Bands 1 and 2 represent the most characteristic bands, as described in the text. Band 3 represents the strain known to contain the tfdA gene R. eutropha JMP134. The ladder is a 100-bp DNA ladder. (B) Southern hybridization analysis of the agarose gel shown in A using a tfdA probe. Similarity can be detected for bands 2 and 3.
FIG. 5.
FIG. 5.
Nonfitted mineralization and degradation curves compared with the log number of tfdA genes using the tfdA** primer set in the soil. (A) Top2.3; (B) Top20; (C) Sub2.3. Error bars indicate standard errors.
FIG. 6.
FIG. 6.
Melting profiles of real-time PCR amplification products of soil DNA from days 0, 12, and 22 in Top20 using the tfdA-II primer set and the QuantiTect SYBR green PCR kit. Furthermore, the melting profile of the PCR amplification product from the tfdA-containing strain R. eutropha JMP134 is shown. The profile displays the negative first derivative of temperature versus relative fluorescence units (RFU) [−d(RFU)/dT] plotted against temperature.
FIG. 7.
FIG. 7.
Functional diversity of MCPA degrader genes using PCR/DGGE analysis with the tfdA** primer set. The gene product was separated using 55 to 70% urea gels. DNA extracts from days 0, 6, 12, 33, and 68 were analyzed in real triplicates. For the marker profile (M), DNA extracts from soil samples inoculated with the tfdA-containing strain R. eutropha JMP134 were used. A1 to A10 indicate bands selected for sequence analysis from topsoil DNA, and B1 to B3 indicate bands selected for sequence analysis from subsoil DNA. A shows the DGGE profile of DNA extracted from Top2.3, B shows the DGGE profile of DNA extracted from Top20, and C shows the DGGE profile of DNA extracted from Sub2.3. D shows the DGGE profile of DNA extracted from Top0, and E shows the DGGE profile of DNA extracted from Sub0.
FIG. 8.
FIG. 8.
Sequence alignment of the DNA obtained with the tfdA** primer set. The position number relates to GenBank accession number M16730 (R. eutropha JMP134). The class I tfdA gene sequence represented by R. eutropha JMP134 and the class III tfdA sequence represented by Burkholderia cepacia pIJB were both obtained from GenBank. A2 and A9 correspond to the sequences obtained at day 68 and day 0, respectively. These products were run on a DGGE gel and stabbed prior to sequencing as indicated in the legend of Fig. 7. A2 is highly homologous to bands A1, A3 to A7, A10, and B1 to B3, while A9 and A8 are homologous. Black shading shows highly conserved regions. Designations in brackets are GenBank database accession numbers.

Similar articles

Cited by

References

    1. Acea, M. J., and M. Alexander. 1988. Growth and survival of bacteria introduced into carbon amended soil. Soil Biol. Biochem. 20:703-709.
    1. Acea, M. J., C. R. Moore, and M. Alexander. 1988. Survival and growth of bacteria introduced into soil. Soil Biol. Biochem. 20:509-515.
    1. Altschul, S. F., W. Gish, W. Miller, E. W. Myers, and D. J. Lipman. 1990. Basic local alignment search tool. J. Mol. Biol. 215:403-410. - PubMed
    1. Amy, P. S., J. W. Schulke, L. M. Frazier, and R. J. Seidler. 1985. Characterization of aquatic bacteria and cloning of genes specifying partial degradation of 2,4-dichlorophenoxyacetic acid. Appl. Environ. Microbiol. 49:1237-1245. - PMC - PubMed
    1. Andersen, S. M., P. B. Hertz, T. Holst, R. Bossi, and C. S. Jacobsen. 2001. Mineralization studies of 14C-labelled metsulfuron-methyl, tribenuron-methyl, chlorsulfuron and thifensulfuron-methyl in one Danish soil and groundwater sediment profile. Chemosphere 45:775-782. - PubMed

Publication types

MeSH terms

LinkOut - more resources