. 2006 Feb 14;103(7):2316-21.
doi: 10.1073/pnas.0508776103. Epub 2006 Feb 6.

Amplification of MET may identify a subset of cancers with extreme sensitivity to the selective tyrosine kinase inhibitor PHA-665752

Affiliations

Amplification of MET may identify a subset of cancers with extreme sensitivity to the selective tyrosine kinase inhibitor PHA-665752

Gromoslaw A Smolen et al. Proc Natl Acad Sci U S A. .

Erratum in

Abstract

The success of molecular targeted therapy in cancer may depend on the selection of appropriate tumor types whose survival depends on the drug target, so-called "oncogene addiction." Preclinical approaches to defining drug-responsive subsets are needed if initial clinical trials are to be directed at the most susceptible patient population. Here, we show that gastric cancer cells with high-level stable chromosomal amplification of the growth factor receptor MET are extraordinarily susceptible to the selective inhibitor PHA-665752. Although MET activation has primarily been linked with tumor cell migration and invasiveness, the amplified wild-type MET in these cells is constitutively activated, and its continued signaling is required for cell survival. Treatment with PHA-665752 triggers massive apoptosis in 5 of 5 gastric cancer cell lines with MET amplification but in 0 of 12 without increased gene copy numbers (P = 0.00016). MET amplification may thus identify a subset of epithelial cancers that are uniquely sensitive to disruption of this pathway and define a patient group that is appropriate for clinical trials of targeted therapy using MET inhibitors.


Conflict of interest statement

Conflict of interest statement: No conflicts declared.

Figures
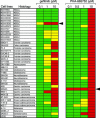
Fig. 1.
Fig. 1.
Drug sensitivity profile of 40 human cancer cell lines treated with gefitinib or PHA-665752. Cells were cultured and analyzed in triplicate within microtiter plates. Cell numbers were quantitated by DNA staining, 3 days after addition of various concentrations of drugs and expressed as a fraction of matched untreated cultures. For each drug concentration, cell lines with relative drug sensitivity (<50% of untreated control growth) are shown in red, intermediate sensitivity (50–75%) in yellow, and drug insensitivity (>75%) in green. Arrowheads denote cell lines with unique drug sensitivity to gefitinib (NCI-H1650) or to PHA-665752 (MKN45).
Fig. 2.
Fig. 2.
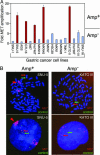
MET genomic amplification in human gastric cancer cell lines. (A) Human gastric cancer cell lines screened for the presence of MET amplification by using qPCR. The relative MET copy number is derived by comparison with an unrelated control locus, TOP3A, at chromosome locus 17p11. Cell lines with high-level MET amplification (Amp+) are shown in red, whereas the cells with no or low-level copy number increase of MET (Amp) are shown in blue. All Amp+ cells have HSR-amplification of MET. (B) Representative metaphase (Upper) and interphase (Lower) FISH analysis of human gastric cancer cell lines, showing amplification of MET within characteristic HSRs in Amp+ cells. In SNU-5 cells (Amp+) with high-level amplification, the MET signal (red) is present in HSRs (red arrowhead) that are distinct from the endogenous gene locus (chromosome 7q31, red arrow). Control probe on the opposite arm of chromosome 7 (chromosome 7p21) is shown in green (green arrow). In KATO III cells (Amp), the low-level increased MET gene copy number is associated with five individual copies of chromosome 7 (aneuploidy).
Fig. 3.
Fig. 3.
Constitutive activation of MET in Amp+ cells. (A) MET is constitutively activated in the Amp+ cells. Immunoblotting analysis, demonstrating high levels of MET protein expression in two representative Amp+ cell lines, compared with two Amp cell lines. Immunoblotting using two phospho-specific MET antibodies (against Y1234∕1235 and Y1349) shows strong baseline phosphorylation of the receptor only in Amp+ cells (β-actin loading control). (B) Effect of HGF on MET activation in Amp+ and Amp cells. Representative immunoblotting analysis of cells serum-starved for 24 h and treated with 40 ng∕ml HGF for 10 min. Phosphorylation of MET (Y1234∕1235) is induced by HGF in Amp cells, but it is unaltered in Amp+ cells treated with HGF (total MET expression in these cells is shown as control). Phosphorylation of the downstream effectors ERK1∕2 (T202∕Y204) and AKT (S473) is also strongly induced in Amp cells treated with HGF but unaltered by HGF treatment in Amp+ cells. Blots probed with phospho-specific antibodies were exposed for a short time to illustrate signaling differences and to avoid potential signal saturation associated with longer exposure times. (C) Neutralizing HGF antibody does not affect MET activation in Amp+ cells. Representative Western blot, demonstrating unaltered baseline activation of MET in Amp+ cells (MKN45) treated with neutralizing anti-HGF antibody. Cells were serum starved for 24 h and subsequently treated with 5 μg∕ml anti-HGF antibody or goat IgG control in serum-free media for another 24 h, by using standard conditions for neutralization of HGF (30). (D) Neutralizing HGF antibody can functionally inactivate HGF-mediated MET activation in Amp cells. As control for C, Amp cells (AGS) were treated with HGF alone, with neutralizing antibody to HGF, or goat IgG (control). Suppression of HGF-induced MET activation in Amp cells confirms effective HGF neutralizing activity of this anti-HGF antibody.
Fig. 4.
Fig. 4.
Selective killing of gastric cancer cell lines with MET amplification after MET inhibition. (A) Sensitivity of Amp+ cells (red) and Amp cells (black) to increasing concentrations of PHA-665752. Cells were grown for 96 h at various concentrations of PHA-665752, and their viability was assessed by using MTT assays. Results are plotted as percent viability of treated cells compared with untreated matched controls. Experiments were performed in triplicate, with standard deviations shown. (B) Growth curve of representative Amp+ and Amp cells treated with PHA-665752. Cells were grown for up to 6 days in the presence or absence of PHA-665752 (1 μM), and relative cell numbers were measured by using the fluorescent nucleic acid dye SYTO60 and expressed as a fraction of the number of cells plated. Experiments were performed in triplicate, with standard deviations shown. (C) Effective knockdown of targeted receptor tyrosine kinases by using siRNAs. Immunoblotting analysis of MET, EGFR, and ERBB2 protein levels after treatment of Amp+ and Amp cells with specific siRNAs for 48 h. The relative exposure time of MET signal in Amp immunoblots was increased to demonstrate effectiveness of siRNA knockdown (β-actin loading control). (D) Selective killing of Amp+ cells after siRNA-mediated knockdown of MET. Viability in Amp+ and Amp cells, measured by using the MTT assay, was compared 96 h after knockdown of MET or unrelated receptors (EGFR and ERBB2). Cell viability is plotted as a percentage of cells treated with a nonspecific (control) siRNA duplex. Experiments were performed in triplicate, with standard deviations shown.
Fig. 5.
Fig. 5.
Suppression of MET-dependent signals by PHA-665752 in Amp+ cells and induction of apoptosis. (A) Immunoblotting analysis, demonstrating inhibition of MET autophosphorylation (Y1234∕1235) by PHA-665752. Abrogation of baseline phosphorylation of downstream effectors [ERK1∕2 (T202∕Y204), AKT (S473), STAT3 (Y727), and FAK (Y576∕Y577)] is evident after drug treatment in Amp+ cells but not in Amp cells. PHA-665752 was added for 3 h before protein extraction (representative blots shown). (B) Induction of apoptosis in Amp+ cells, but not in Amp cells, 72 h after treatment with PHA-665752 (1 μM), measured by staining for cleaved caspase-3 (green). Cells are costained with DAPI (blue) to show nuclei. (C) Immunoblotting analysis for PARP cleavage to demonstrate induction of apoptosis in Amp+ cells, but not Amp cells, after treatment with PHA-665752 (500 nM for 72 h) (β-actin loading control).

References

    1. Weinstein I. B. Science. 2002;297:63–64. - PubMed
    1. Apperley J. F., Gardembas M., Melo J. V., Russell-Jones R., Bain B. J., Baxter E. J., Chase A., Chessells J. M., Colombat M., Dearden C. E., et al. N. Engl. J. Med. 2002;347:481–487. - PubMed
    1. Druker B. J., Talpaz M., Resta D. J., Peng B., Buchdunger E., Ford J. M., Lydon N. B., Kantarjian H., Capdeville R., Ohno-Jones, et al. N. Engl. J. Med. 2001;344:1031–1037. - PubMed
    1. Heinrich M. C., Corless C. L., Demetri G. D., Blanke C. D., von Mehren M., Joensuu H., McGreevey L. S., Chen C. J., Van den Abbeele A. D., Druker B. J., et al. J. Clin. Oncol. 2003;21:4342–4349. - PubMed
    1. Lynch T. J., Bell D. W., Sordella R., Gurubhagavatula S., Okimoto R. A., Brannigan B. W., Harris P. L., Haserlat S. M., Supko J. G., Haluska F. G., et al. N. Engl. J. Med. 2004;350:2129–2139. - PubMed

Publication types

Substances