. 2006 Feb 14;103(7):2422-7.
doi: 10.1073/pnas.0511041103. Epub 2006 Feb 6.

Reciprocal actions of REST and a microRNA promote neuronal identity

Affiliations

Reciprocal actions of REST and a microRNA promote neuronal identity

Cecilia Conaco et al. Proc Natl Acad Sci U S A. .

Abstract

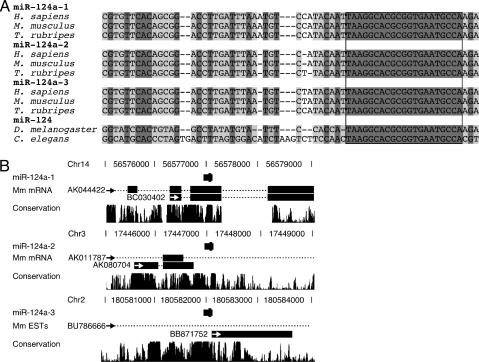
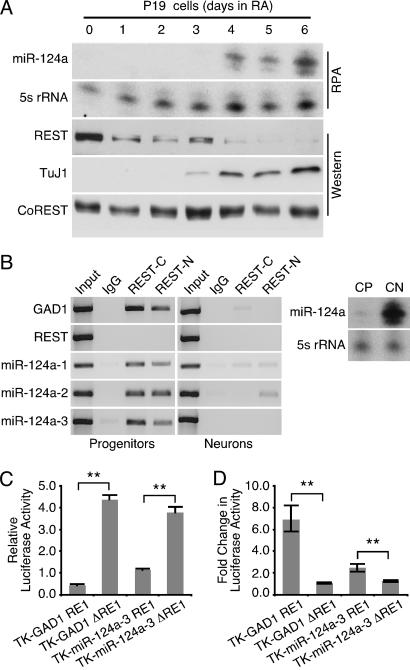
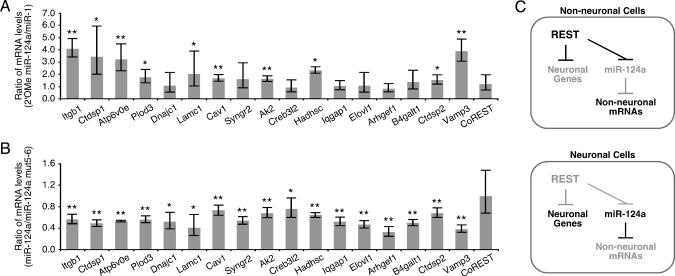
MicroRNAs (miRNAs) are implicated in both tissue differentiation and maintenance of tissue identity. In most cases, however, the mechanisms underlying their regulation are not known. One brain-specific miRNA, miR-124a, decreases the levels of hundreds of nonneuronal transcripts, such that its introduction into HeLa cells promotes a neuronal-like mRNA profile. The transcriptional repressor, RE1 silencing transcription factor (REST), has a reciprocal activity, inhibiting the expression of neuronal genes in nonneuronal cells. Here, we show that REST regulates the expression of a family of miRNAs, including brain-specific miR-124a. In nonneuronal cells and neural progenitors, REST inhibits miR-124a expression, allowing the persistence of nonneuronal transcripts. As progenitors differentiate into mature neurons, REST leaves miR-124a gene loci, and nonneuronal transcripts are degraded selectively. Thus, the combined transcriptional and posttranscriptional consequences of REST action maximize the contrast between neuronal and nonneuronal cell phenotypes.


Conflict of interest statement

Conflict of interest statement: No conflicts declared.

Figures

Fig. 1.
Fig. 1.
REST occupies RE1 sites associated with a family of miRNAs. (A) miRNA genes identified as potential REST targets in a REST SACO screen bind REST in vivo. (Left) Schematic diagram showing chromosomal locations of RE1 sites (vertical lines) with respect to the predicted stem-loop precursors of the miRNA transcripts (gray boxes). (Right) ChIP analysis showing REST occupancy at the miRNA loci in TCMK1 kidney cells. REST-N and REST-C refer to Abs directed against the N and C termini of REST. Rabbit IgG served as control. (B and C) Quantitative PCR analysis showing that endogenous miRNA genes are regulated by REST. Levels of miRNAs were measured 24 h after transduction of MEFs with dnREST (B) or of E15.5 postmitotic cortical neurons with REST (C). miRNA levels were normalized to endogenous GAPDH mRNA. Fold changes in miRNA expression are shown as the ratio of geometric means of transcript levels in cells expressing dnREST or full-length REST relative to cells transduced with an adenovirus expressing only GFP. The limits of the 95% confidence intervals indicate variability of the changes (∗, P ≤ 0.05; ∗∗, P ≤ 0.005, Student’s t test).
Fig. 2.
Fig. 2.
Conservation of miR-124a. (A) Comparison of miR-124astem-loop precursor sequences across species. Nucleotides conserved across all species are shown in dark gray, and regions conserved in vertebrates, but not in invertebrates, are in light gray. The box indicates the sequence of mature miR-124a. (B) Predicted stem-loop precursors for each miRNA are depicted as short filled rectangles with a vertical bar representing the mature miRNA. miR-124a-1 and -124a-2 are located within GenBank transcripts, and miR-124a-3 is located within a mouse EST (arrows indicate direction of transcription). Alignment scores, indicated by black bars in the conservation track, show that the three miR-124a loci are located in conserved regions of the mouse genome (UCSC, Mm5 assembly).
Fig. 3.
Fig. 3.
REST confers neuronal specificity of miR-124a. (A) Western blot and ribonuclease protection assay (RPA) showing the disappearance of REST protein and appearance of mature miR-124a during neuronal differentiation of P19 cells with retinoic acid (RA). Neuronal βIII-tubulin (TuJ1) indicates presence of mature neurons. Levels of 5s rRNA and CoREST protein serve as controls. (B Left) ChIP analysis showing REST leaving the chromatin of the three miR-124a loci as cortical progenitors differentiate into cortical neurons. The neuronal-specific GAD1 gene and REST coding sequence serve as positive and negative controls, respectively. (Right) RPA analysis showing miR-124a expression in cortical neurons (CN) but not in cortical progenitors (CP). (C) Luciferase reporter analysis showing that RE1-containing constructs (TK-miR-124a-3 RE1, TK-GAD1 RE1) transfected into TCMK1 kidney cells have lower luciferase activity compared with constructs lacking the RE1 (TK-miR-124a-3 ΔRE1, TK-GAD1 ΔRE1). Relative luciferase activity was measured after 48 h. Error bars represent SD from three independent experiments (∗∗, P ≤ 0.005, Student’s t test). (D) Luciferase reporter assay in TCMK1 kidney cells showing derepression of reporters bearing the RE1s of miR-124a-3 and GAD1 upon introduction of dnREST. Fold changes in luciferase activity are shown as the ratios of the geometric means of reporter activity with and without dnREST. Variability is indicated by the limits of the 95% confidence intervals (∗∗, P ≤ 0.005, Student’s t test).
Fig. 4.
Fig. 4.
Inhibition of miR-124a in neurons unmasks regulation of nonneuronal transcripts. (A) Quantitative PCR showing that depletion of miR-124a using an antisense 2′-OMe oligoribonucleotide results in increased levels of nonneuronal transcripts in cortical neurons. The level of the nontarget transcript for CoREST did not change. Expression of target mRNAs was measured after 48 h and normalized to GAPDH. Fold changes in mRNA expression are shown as the ratio of the geometric means of transcript levels in cells transfected with an antisense 2′-OMe to miR-124a relative to cells transfected with an antisense 2′-OMe to muscle-specific miR-1. Variability is indicated by the limits of the 95% confidence intervals (∗, P ≤ 0.05, ∗∗, P ≤ 0.005, Student’s t test). (B) Quantitative PCR showing that overexpression of miR-124a down-regulates nonneuronal transcripts in MEFs. Expression of target mRNAs was measured after 24 h and normalized to GAPDH. Fold changes in mRNA expression are shown as the ratio of the geometric means of transcript levels in cells overexpressing miR-124a relative to cells treated with an inactive mutated version of miR-124a (miR-124a mut5–6). Variability is indicated by the limits of the 95% confidence intervals. (C) A hierarchy of two global negative regulators, REST and miR-124a, promotes a neuronal phenotype. (Upper) REST transcriptionally represses neuronal genes and miR-124a in nonneuronal cells and neural progenitors. (Lower) The dismissal of REST from chromatin during neurogenesis results in en masse expression of neuronal genes and down-regulation of competing nonneuronal transcripts through miR-124a function.

Similar articles

Cited by

References

    1. Edlund T., Jessell T. M. Cell. 1999;96:211–224. - PubMed
    1. Munoz-San Juan I., Brivanlou A. H. Nat. Rev. Neurosci. 2002;3:271–280. - PubMed
    1. Chong J. A., Tapia-Ramirez J., Kim S., Toledo-Aral J. J., Zheng Y., Boutros M. C., Altshuller Y. M., Frohman M. A., Kraner S. D., Mandel G. Cell. 1995;80:949–957. - PubMed
    1. Schoenherr C. J., Anderson D. J. Science. 1995;267:1360–1363. - PubMed
    1. Andres M. E., Burger C., Peral-Rubio M. J., Battaglioli E., Anderson M. E., Grimes J., Dallman J., Ballas N., Mandel G. Proc. Natl. Acad. Sci. USA. 1999;96:9873–9878. - PMC - PubMed

Publication types

LinkOut - more resources