. 2006 Feb 7:7:56.
doi: 10.1186/1471-2105-7-56.

A methodology for the structural and functional analysis of signaling and regulatory networks

Affiliations

A methodology for the structural and functional analysis of signaling and regulatory networks

Steffen Klamt et al. BMC Bioinformatics. .

Abstract

Background: Structural analysis of cellular interaction networks contributes to a deeper understanding of network-wide interdependencies, causal relationships, and basic functional capabilities. While the structural analysis of metabolic networks is a well-established field, similar methodologies have been scarcely developed and applied to signaling and regulatory networks.

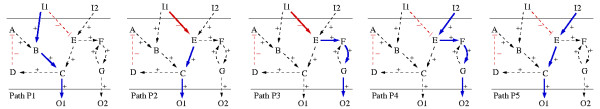
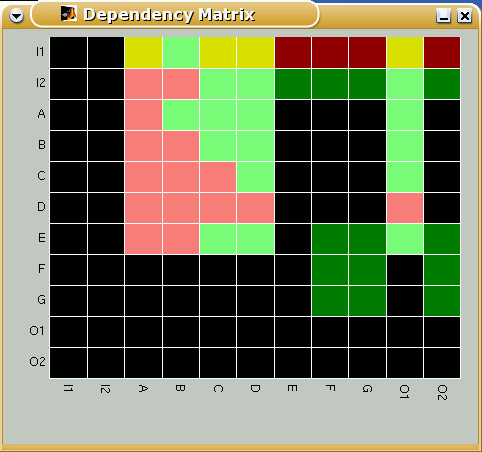
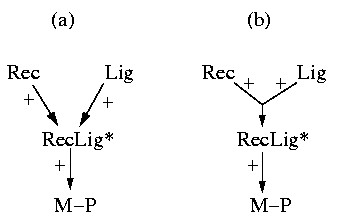
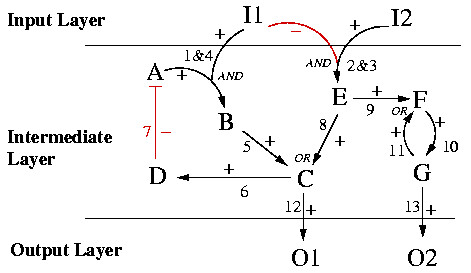
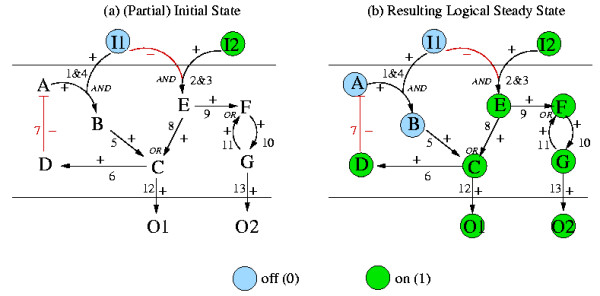
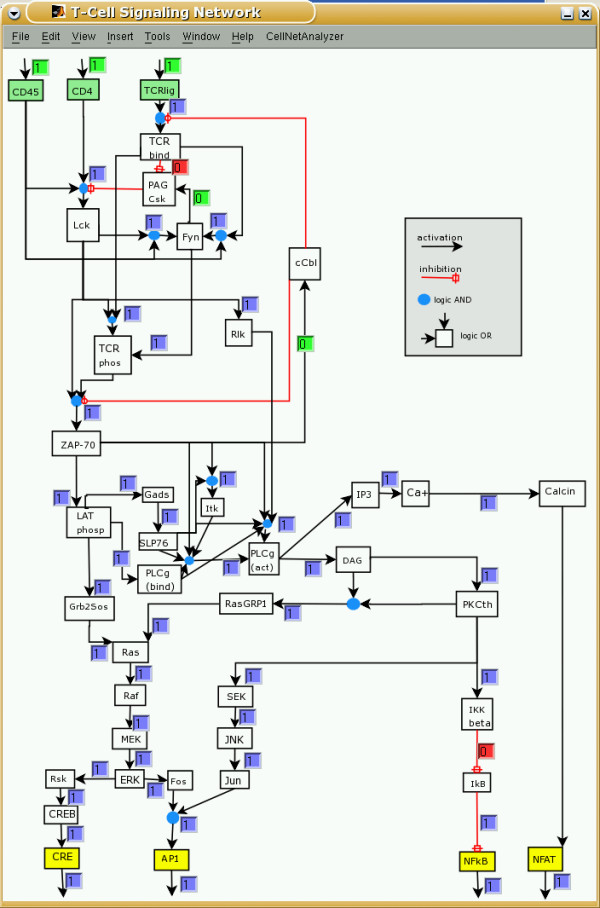
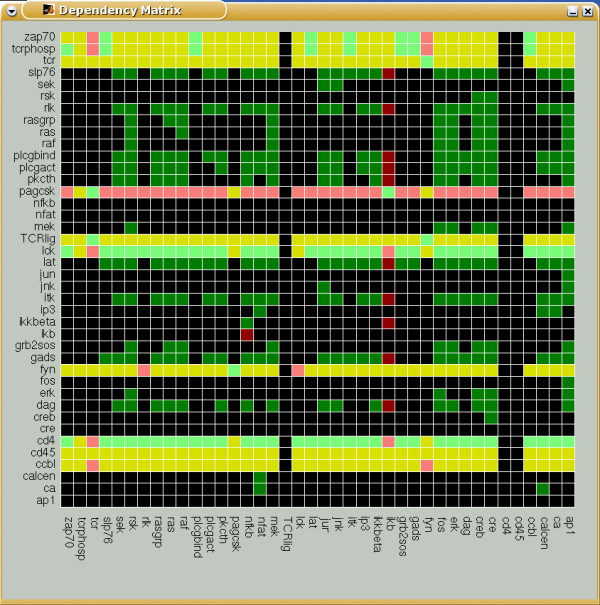
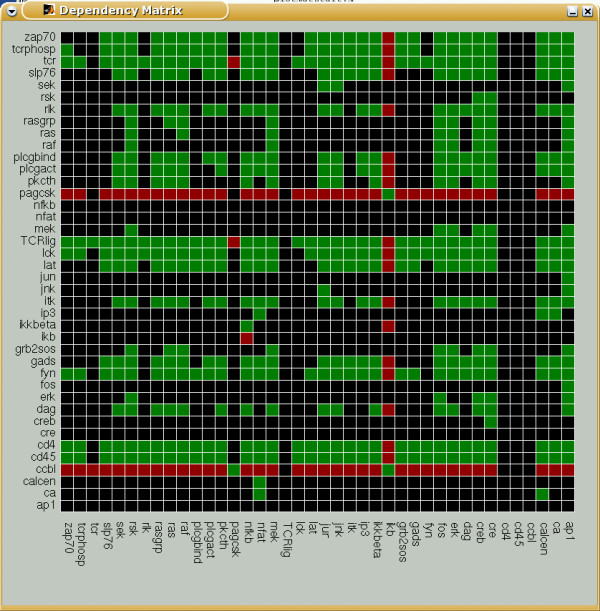
Results: We propose formalisms and methods, relying on adapted and partially newly introduced approaches, which facilitate a structural analysis of signaling and regulatory networks with focus on functional aspects. We use two different formalisms to represent and analyze interaction networks: interaction graphs and (logical) interaction hypergraphs. We show that, in interaction graphs, the determination of feedback cycles and of all the signaling paths between any pair of species is equivalent to the computation of elementary modes known from metabolic networks. Knowledge on the set of signaling paths and feedback loops facilitates the computation of intervention strategies and the classification of compounds into activators, inhibitors, ambivalent factors, and non-affecting factors with respect to a certain species. In some cases, qualitative effects induced by perturbations can be unambiguously predicted from the network scheme. Interaction graphs however, are not able to capture AND relationships which do frequently occur in interaction networks. The consequent logical concatenation of all the arcs pointing into a species leads to Boolean networks. For a Boolean representation of cellular interaction networks we propose a formalism based on logical (or signed) interaction hypergraphs, which facilitates in particular a logical steady state analysis (LSSA). LSSA enables studies on the logical processing of signals and the identification of optimal intervention points (targets) in cellular networks. LSSA also reveals network regions whose parametrization and initial states are crucial for the dynamic behavior. We have implemented these methods in our software tool CellNetAnalyzer (successor of FluxAnalyzer) and illustrate their applicability using a logical model of T-Cell receptor signaling providing non-intuitive results regarding feedback loops, essential elements, and (logical) signal processing upon different stimuli.

Conclusion: The methods and formalisms we propose herein are another step towards the comprehensive functional analysis of cellular interaction networks. Their potential, shown on a realistic T-cell signaling model, makes them a promising tool.


Figures

Figure 1
Figure 1
(a) Example of a typical signaling pathway where mass and signal flow occur simultaneosly (Rec = receptor; Lig = ligand; RecLig* = (active) receptor-ligand-complex; M = molecule; M-P = phosphorylated molecule M). (b) The (only) elementary mode in this example which follows when M, M-P, ADP, ATP, Rec and Lig are considered as external (boundary) species. The involved reactions are indicated by green, thick arrows. In its net stoichiometry, this elementary mode converts M and ATP into M-P and ADP, whereas RecLig* is recycled in the overall process. Importantly, the mandatory process of building the receptor-ligand-complex RecLig* (hence, the causal dependeny of M-P from the availability of Rec and Lig) is not reflected by this mode.
Figure 2
Figure 2
Interpretation of Figure 1 as an interaction network.
Figure 3
Figure 3
Example of a directed interaction graph (TOYNET). Arcs 2 and 7 indicate inhibiting interactions, while all others are activating.
Figure 4
Figure 4
Computation of all signaling paths between two species (here: between I1 and O1). (a) via the incorporation of a "simplified" input and output arc; (b) with explicit introduction of an ENV („environment") node. Computing the elementary modes from the respective incidence matrix for (a) and (b) yields basically the same result, namely all paths between I1 and O1, as well as the two feedback circuits in the intermediate layer.
Figure 5
Figure 5
All signaling paths linking the input layer (source species) with the output layer (sink species) in TOYNET.
Figure 6
Figure 6
Dependency matrix of TOYNET. The color of a matrix element Mxy has the following meaning: (i) dark green: x is an total activator of y; (ii) light green: x is a (non-total) activator of y; (iii) dark red: x is a total inhibitor of y; (iv) light red: x is a (non-total) inhibitor of y; (v) yellow: x is an ambivalent factor for y; (vi) black: x does not influence y;
Figure 7
Figure 7
(a) the graphical and (b) the more correct hypergraphical representation of the simple interaction network shown in Figure 1 and 2.
Figure 8
Figure 8
Logical interaction hypergraph of TOYNET (compare with interaction graph in Figure 3).
Figure 9
Figure 9
Example of a logical steady state in TOYNET resulting from a particular set of initial states in the input layer.
Figure 10
Figure 10
Screenshot of the CellNetAnalyzer model for T-cell activation. Each arrow finishing on a species box represents a hyperarc and all the hyperarcs pointing into a species box are OR connected. In the shown "early-event" scenario, the feedbacks were switched off whereas all input arcs are active. The resulting logical steady state was then computed. Text boxes display the signal flows along the hyperarcs (green boxes: fixed values prior computation; blue boxes: hyperarcs activating a species (signal flow is 1); red boxes: hyperarcs which are not active (signal flow is 0)).
Figure 11
Figure 11
Dependency matrix for the T-cell model. The meaning of the different colors is the same as in Figure 6.
Figure 12
Figure 12
Dependency matrix for the T-cell model for the early event scenario (τ = 1: the feedback loops are not active). The meaning of the different colors is the same as in Figure 6.
Figure 13
Figure 13
Simulation results of LSS analysis of key elements of the T-cell model using the two time-scales explained in the text. Blue line: upon TCR+CD4+CD45 activation; dashed red line: only TCR+CD45 activation.

References

    1. Downward J. The ins and outs of signalling. Nature. 2001;411:759–762. doi: 10.1038/35081138. - DOI - PubMed
    1. Papin JA, Hunter T, Palsson BO, Subramaniam S. Reconstruction of cellular signalling networks and analysis of their properties. Nat Rev Mol Cell Biol. 2005;6:99–111. doi: 10.1038/nrm1570. - DOI - PubMed
    1. Kholodenko BN. Negative feedback and ultrasensitivity can bring about oscillations in the mitogen-activated protein kinase cascades. Eur J Biochem. 2000;267:1583–8. doi: 10.1046/j.1432-1327.2000.01197.x. - DOI - PubMed
    1. Schoeberl B, Eichler-Jonsson C, Gilles ED, Müller G. Computational modeling of the dynamics of the MAP kinase cascade activated by surface and internalized EGF receptors. Nat Biotech. 2002;20:370–375. doi: 10.1038/nbt0402-370. - DOI - PubMed
    1. Sauro HM, Kholodenko BN. Quantitative analysis of signaling networks. Biophysics & Molecular Biology. 2004;86:5–43. doi: 10.1016/j.pbiomolbio.2004.03.002. - DOI - PubMed

Publication types

MeSH terms

LinkOut - more resources