

Is technological change in medicine always worth it? The case of acute myocardial infarction
- PMID: 16464904
- PMCID: PMC2117353
- DOI: 10.1377/hlthaff.25.w34
Is technological change in medicine always worth it? The case of acute myocardial infarction
Abstract
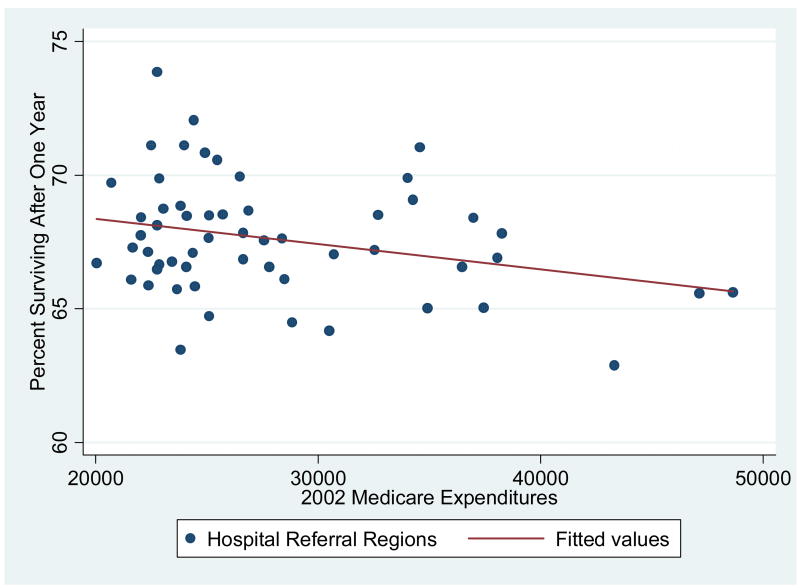
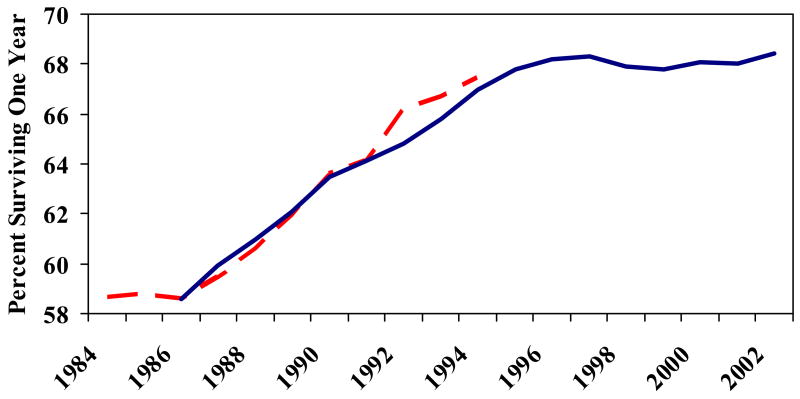
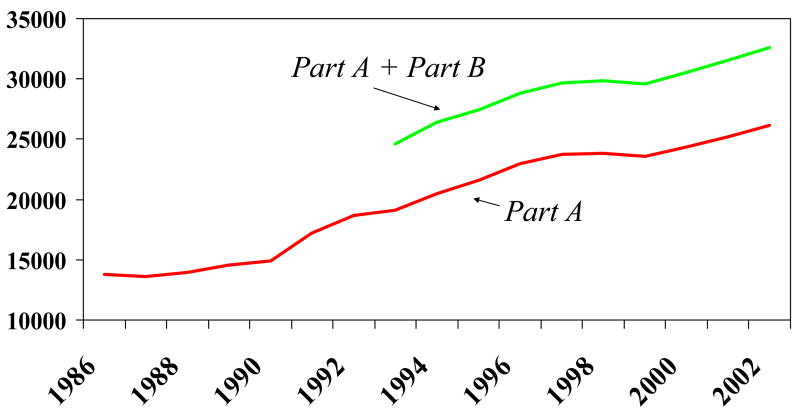
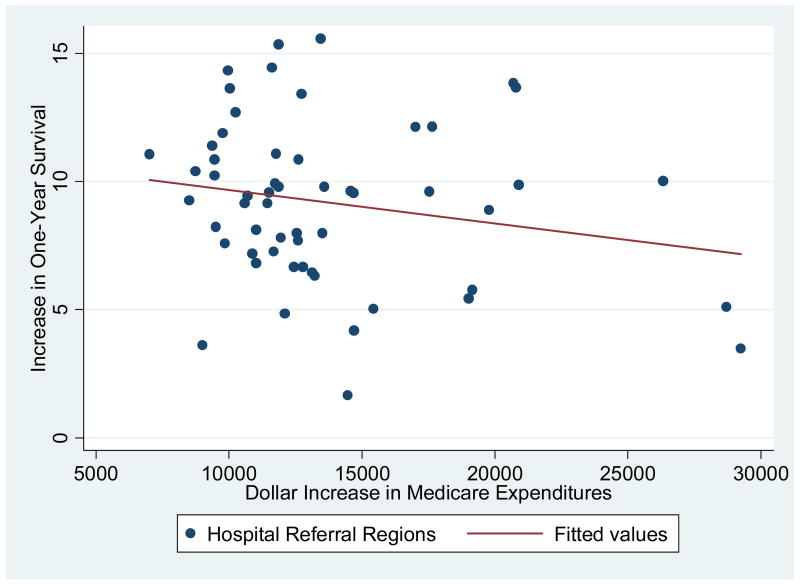
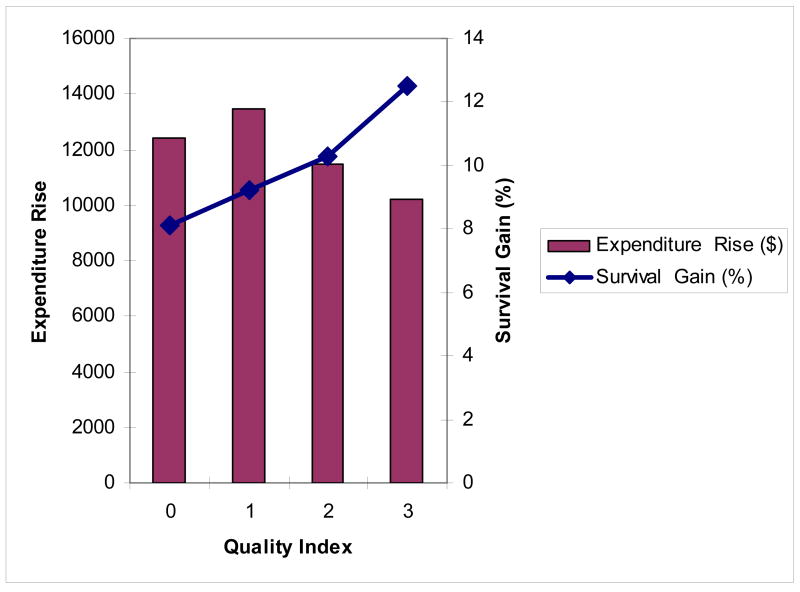
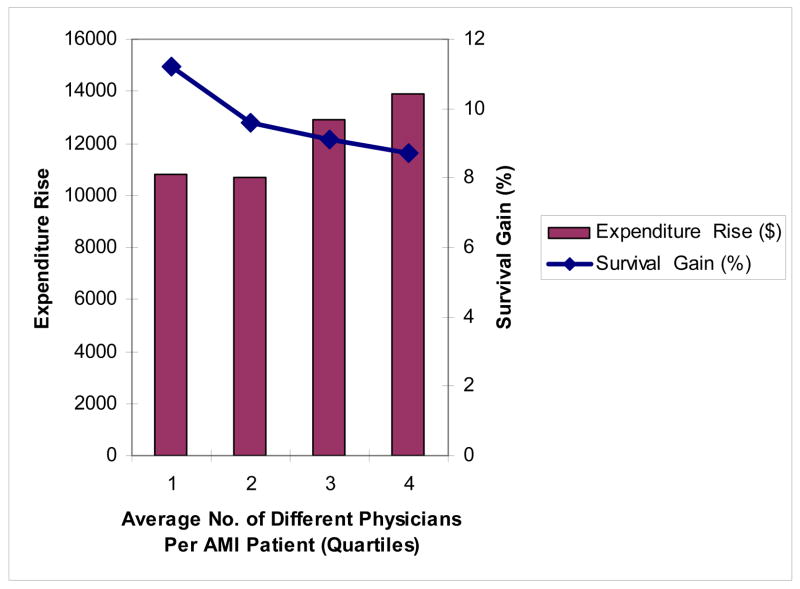
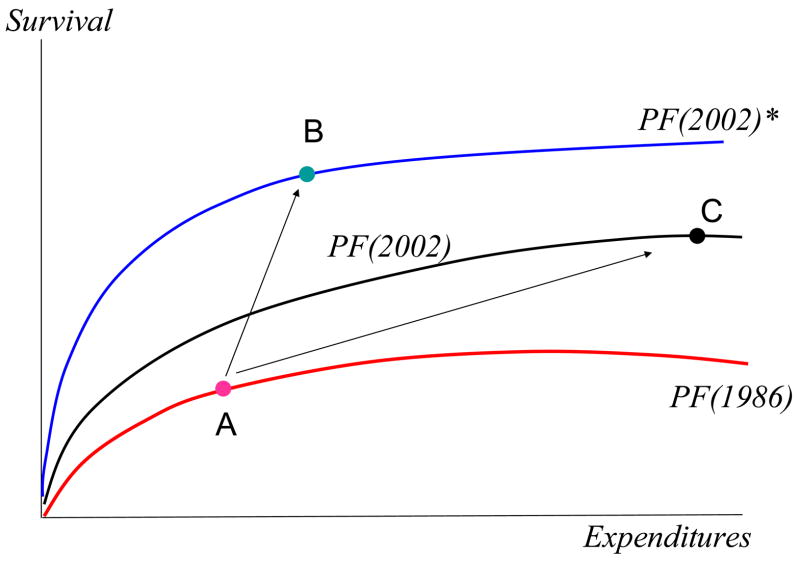
We examine Medicare costs and survival gains for acute myocardial infarction (AMI) during 1986-2002. As David Cutler and Mark McClellan did in earlier work, we find that overall gains in post-AMI survival more than justified the increases in costs during this period. Since 1996, however, survival gains have stagnated, while spending has continued to increase. We also consider changes in spending and outcomes at the regional level. Regions experiencing the largest spending gains were not those realizing the greatest improvements in survival. Factors yielding the greatest benefits to health were not the factors that drove up costs, and vice versa.
Figures
Comment in
-
Making sense of medical technology.Health Aff (Millwood). 2006 Mar-Apr;25(2):w48-50. doi: 10.1377/hlthaff.25.w48. Epub 2006 Feb 7. Health Aff (Millwood). 2006. PMID: 16464902
-
To use technology better.Health Aff (Millwood). 2006 Mar-Apr;25(2):w51-3. doi: 10.1377/hlthaff.25.w51. Epub 2006 Feb 7. Health Aff (Millwood). 2006. PMID: 16464903
References
-
-
See Cutler DM, McClellan M. Is Technological Change in Medicine Worth It? Health Affairs. 2001 Sept/Oct;:11–29.Cutler DM. Your Money or Your Life: Strong Medicine for America's Health Care System. New York: Oxford University Press; 2004. The pioneering study is Cutler DM, et al. Are Medical Prices Declining? Evidence from Heart Attack Treatments. Quarterly Journal of Economics. 1998 November;113(4):991–1024.
-
-
-
The typical hurdle for cost-effectiveness studies is $50,000 to $100,000 per life year, with some authors arguing that society places even greater value on life-years. See Hirth RA, Chernew ME, Fendrick M. What is the Price of Life and Why Doesn’t It Increase at the Rate of Inflation? Archives of Internal Medicine. 2003 July 28;163(14):1637–1641.
-
-
-
Also see Berndt ER, et al. The Medical Treatment of Depression, 1991–1996: Productive Inefficiency, Expected Outcome Variations and Price Indexes. Journal of Health Economics. 2002;21(3):373–396.Lichtenberg F. The Expanding Pharmaceutical Arsenal in the War on Cancer. In: Murphey Kevin, Robert Topel., editors. Measuring the Gains from Medical Research: An Economic Approach. Chicago: University of Chicago Press; 2003. NBER Working Paper No. 10328 (February 2004), and papers.
-
-
-
Fisher ES, et al. The Implications of Regional Variations in Medicare Spending. Part 1: The Content, Quality, and Accessibility of Care. Annals of Internal Medicine. 2003 February 18;138(4):283–287. and The Implications of Regional Variations in Medicare Spending. Part 2: Health Outcomes and Satisfaction With Care” Annals of Internal Medicine 138 No. 4 (February 18, 2003): 288–299. For a formal instrumental variables analysis, see Jonathan Skinner, Fisher Elliott, Wennberg John. The Efficiency of Medicare. In: Wise D, editor. Analyses in the Economics of Aging. Chicago: University of Chicago Press and NBER; 2005. p. 157.
-
-
- Amitabh Chandra, Baicker Katherine. Medicare Spending and the Quality of Care Received by Medicare Beneficiaries. Health Affairs. 2004 April 7;:W4:184–W4:197. web exclusive. - PubMed
Publication types
MeSH terms
Substances
Grants and funding
LinkOut - more resources
Full Text Sources
Medical