

Network modulation by the subthalamic nucleus in the treatment of Parkinson's disease
- PMID: 16466936
- PMCID: PMC4454374
- DOI: 10.1016/j.neuroimage.2005.12.024
Network modulation by the subthalamic nucleus in the treatment of Parkinson's disease
Abstract
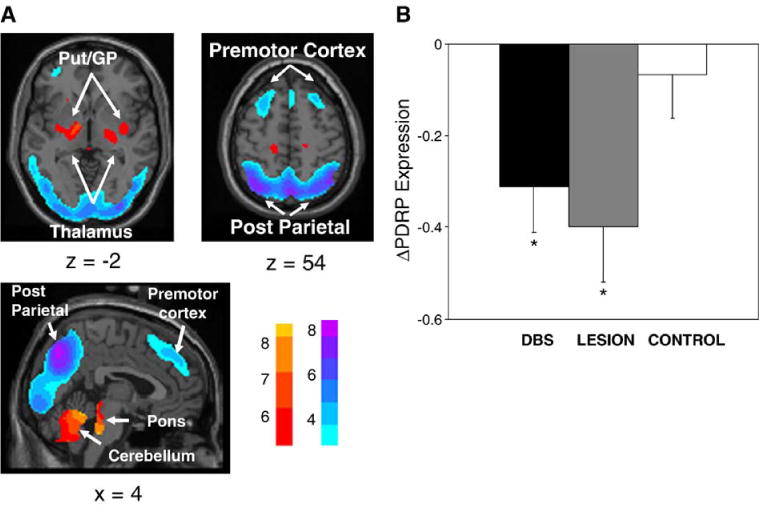
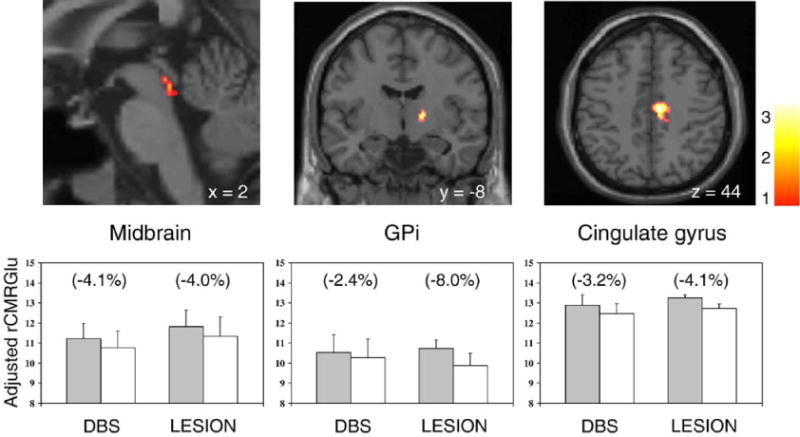
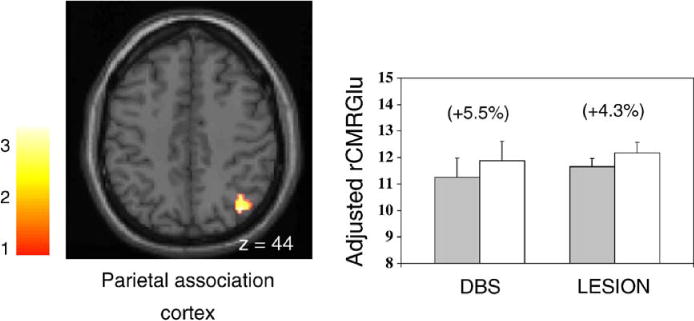
Deep brain stimulation of the subthalamic nucleus (STN DBS) has become an accepted tool for the treatment of Parkinson's disease (PD). Although the precise mechanism of action of this intervention is unknown, its effectiveness has been attributed to the modulation of pathological network activity. We examined this notion using positron emission tomography (PET) to quantify stimulation-induced changes in the expression of a PD-related covariance pattern (PDRP) of regional metabolism. These metabolic changes were also compared with those observed in a similar cohort of patients undergoing STN lesioning. We found that PDRP activity declined significantly (P < 0.02) with STN stimulation. The degree of network modulation with DBS did not differ from that measured following lesioning (P = 0.58). Statistical parametric mapping (SPM) revealed that metabolic reductions in the internal globus pallidus (GPi) and caudal midbrain were common to both STN interventions (P < 0.01), although declines in GPi were more pronounced with lesion. By contrast, elevations in posterior parietal metabolism were common to the two procedures, albeit more pronounced with stimulation. These findings indicate that suppression of abnormal network activity is a feature of both STN stimulation and lesioning. Nonetheless, these two interventions may differ metabolically at a regional level.
Figures
Similar articles
-
Network modulation in the treatment of Parkinson's disease.Brain. 2006 Oct;129(Pt 10):2667-78. doi: 10.1093/brain/awl162. Epub 2006 Jul 14. Brain. 2006. PMID: 16844713 Free PMC article. Clinical Trial.
-
Effective network of deep brain stimulation of subthalamic nucleus with bimodal positron emission tomography/functional magnetic resonance imaging in Parkinson's disease.CNS Neurosci Ther. 2018 Feb;24(2):135-143. doi: 10.1111/cns.12783. Epub 2017 Dec 8. CNS Neurosci Ther. 2018. PMID: 29222835 Free PMC article.
-
Modified Fluorodeoxyglucose Metabolism in Motor Circuitry by Subthalamic Deep Brain Stimulation.Stereotact Funct Neurosurg. 2017;95(2):93-101. doi: 10.1159/000455930. Epub 2017 Mar 4. Stereotact Funct Neurosurg. 2017. PMID: 28259880
-
Cognition and Depression Following Deep Brain Stimulation of the Subthalamic Nucleus and Globus Pallidus Pars Internus in Parkinson's Disease: A Meta-Analysis.Neuropsychol Rev. 2015 Dec;25(4):439-54. doi: 10.1007/s11065-015-9302-0. Epub 2015 Oct 12. Neuropsychol Rev. 2015. PMID: 26459361 Review.
-
Congress of Neurological Surgeons Systematic Review and Evidence-Based Guideline on Subthalamic Nucleus and Globus Pallidus Internus Deep Brain Stimulation for the Treatment of Patients With Parkinson's Disease: Executive Summary.Neurosurgery. 2018 Jun 1;82(6):753-756. doi: 10.1093/neuros/nyy037. Neurosurgery. 2018. PMID: 29538685 Free PMC article.
Cited by
-
The effect of STN DBS on modulating brain oscillations: consequences for motor and cognitive behavior.Exp Brain Res. 2020 Aug;238(7-8):1659-1676. doi: 10.1007/s00221-020-05834-7. Epub 2020 Jun 3. Exp Brain Res. 2020. PMID: 32494849 Free PMC article. Review.
-
The effect of bilateral subthalamic nucleus deep brain stimulation (STN-DBS) on the acoustic and prosodic features in patients with Parkinson's disease: A study protocol for the first trial on Iranian patients.Med J Islam Repub Iran. 2017 Dec 22;31:118. doi: 10.14196/mjiri.31.118. eCollection 2017. Med J Islam Repub Iran. 2017. PMID: 29951419 Free PMC article.
-
The metabolic brain network in patients with Parkinson's disease based on (18)F-FDG PET imaging: evaluation of neuronal injury and regeneration.Neural Regen Res. 2014 Apr 1;9(7):763-5. doi: 10.4103/1673-5374.131586. Neural Regen Res. 2014. PMID: 25206887 Free PMC article. No abstract available.
-
Clinical and brain functional correlates of instrumental rigidity measurement in Parkinson's disease.Sci Rep. 2025 Mar 7;15(1):8056. doi: 10.1038/s41598-025-91567-y. Sci Rep. 2025. PMID: 40055432 Free PMC article.
-
High frequency stimulation of the subthalamic nucleus modulates neurotransmission in limbic brain regions of the rat.Exp Brain Res. 2008 Mar;185(3):497-507. doi: 10.1007/s00221-007-1171-1. Epub 2007 Oct 26. Exp Brain Res. 2008. PMID: 17962928
References
-
- Asanuma K, Ma Y, Huang C, et al. The metabolic pathology of dopa-responsive dystonia. Ann Neurol. 2005a;57:596–600. - PubMed
-
- Asanuma K, Ma Y, Huang C, Feigin A, Dhawan V, Eidelberg D. Hemodynamic and metabolic responses induced by subthalamic nucleus stimulation: An H20 and FDG PET study. NeuroImage. 2005;26(Suppl. 1):S24.
-
- Auker CR, Meszler RM, Carpenter DO. Apparent discrepancy between single-unit activity and [14C]deoxyglucose labeling in optic tectum of the rattlesnake. J Neurophysiol. 1983;49:1504–1516. - PubMed
-
- Benabid AL. Deep brain stimulation for Parkinson’s disease. Curr Opin Neurobiol. 2003;13:696–706. - PubMed
-
- Carbon M, Eidelberg D. Modulation of regional brain function by deep brain stimulation: studies with positron emission tomography. Curr Opin Neurol. 2002;15:451–455. - PubMed
Publication types
MeSH terms
Substances
Grants and funding
LinkOut - more resources
Full Text Sources
Other Literature Sources
Medical
