Comparative Study
. 2006 Jun 15;107(12):4781-9.
doi: 10.1182/blood-2005-12-4818. Epub 2006 Feb 7.

HIV nonprogressors preferentially maintain highly functional HIV-specific CD8+ T cells

Affiliations
Comparative Study

HIV nonprogressors preferentially maintain highly functional HIV-specific CD8+ T cells

Michael R Betts et al. Blood. .

Abstract

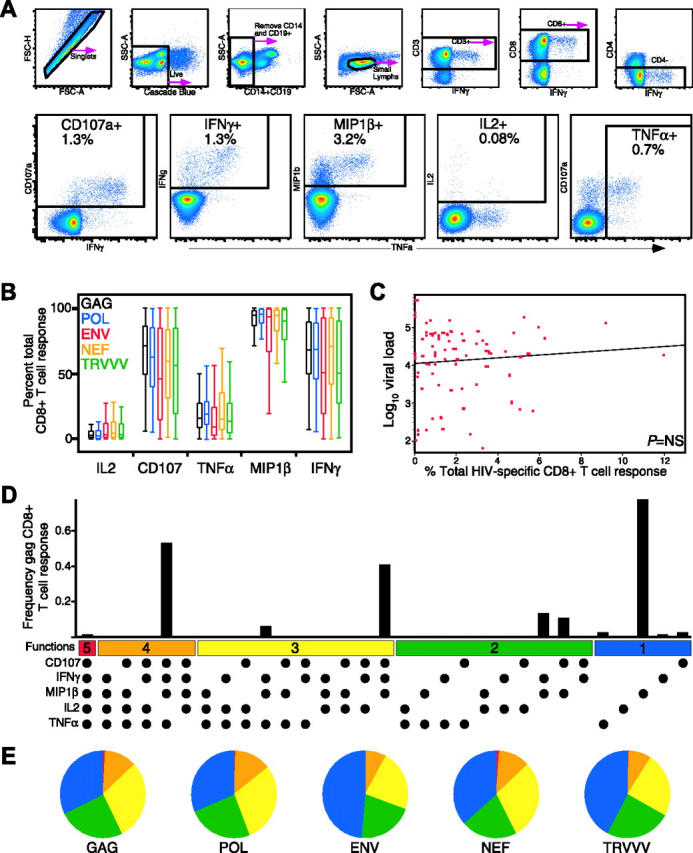
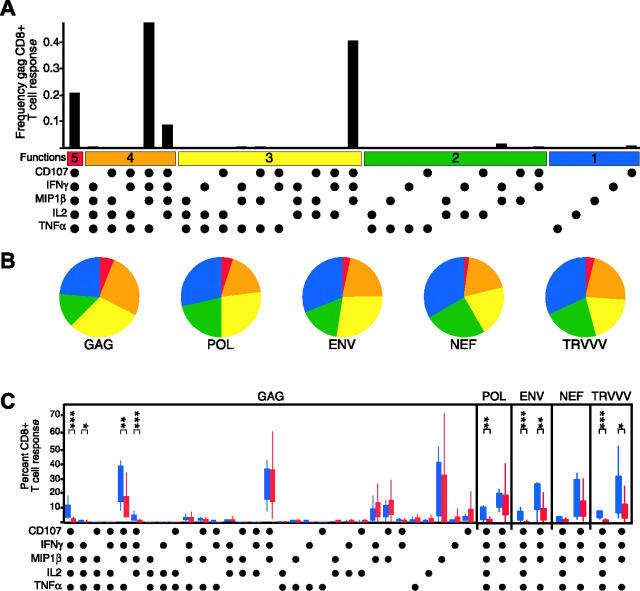
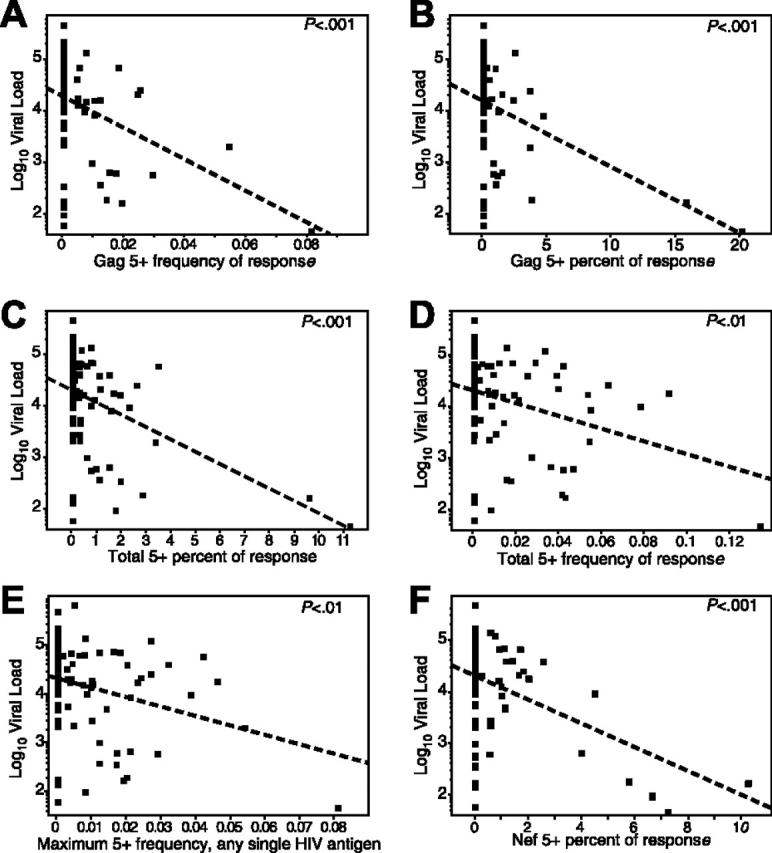
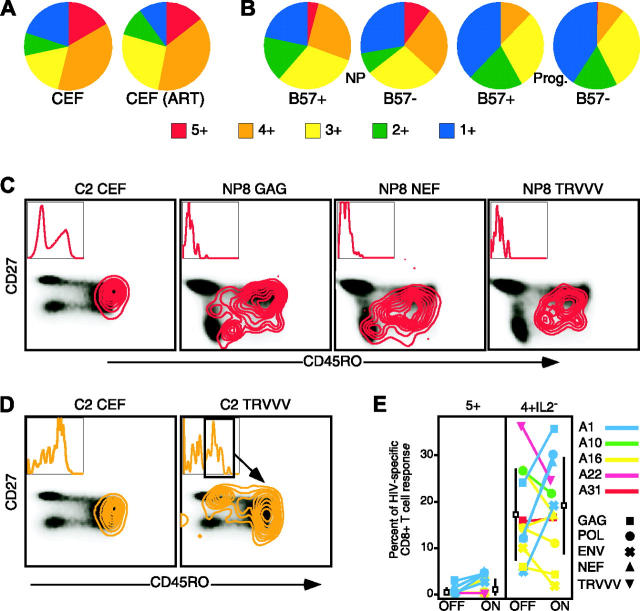
Establishing a CD8(+) T cell-mediated immune correlate of protection in HIV disease is crucial to the development of vaccines designed to generate cell-mediated immunity. Historically, neither the quantity nor breadth of the HIV-specific CD8(+) T-cell response has correlated conclusively with protection. Here, we assess the quality of the HIV-specific CD8(+) T-cell response by measuring 5 CD8(+) T-cell functions (degranulation, IFN-gamma, MIP-1beta, TNF-alpha, and IL-2) simultaneously in chronically HIV-infected individuals and elite nonprogressors. We find that the functional profile of HIV-specific CD8(+) T cells in progressors is limited compared to that of nonprogressors, who consistently maintain highly functional CD8(+) T cells. This limited functionality is independent of HLA type and T-cell memory phenotype, is HIV-specific rather than generalized, and is not effectively restored by therapeutic intervention. Whereas the total HIV-specific CD8(+) T-cell frequency did not correlate with viral load, the frequency and proportion of the HIV-specific T-cell response with highest functionality inversely correlated with viral load in the progressors. Thus, rather than quantity or phenotype, the quality of the CD8(+) T-cell functional response serves as an immune correlate of HIV disease progression and a potential qualifying factor for evaluation of HIV vaccine efficacy.


Figures

Figure 1.
Figure 1.
Detection of 5 concurrent T-cell functions and characterization of HIV-specific CD8+ T-cell functionality in HIV-infected progressors. (A) Gating scheme for identification of multifunctional CD8+ T-cell responses. Shown are representative data of the HIV Gag-specific response from subject A26, an HIV-infected progressor, after a 6-hour in vitro stimulation. See “Patients, materials, and methods” for a detailed explanation of the procedure. (B) MIP-1β is the dominant HIV-specific CD8+ T-cell response (P < .001 for all stimulation conditions). Box plots represent the 10th, 25th, 50th, 75th, and 90th percentiles of the contribution of the indicated functional response (x-axis) toward the total CD8+ T-cell response against the indicated HIV peptide mix (color coded as shown) within the 79 progressors. The responses from each subject were standardized to allow comparison of the proportions of the total response expressing each function irrespective of the others. (C) Total CD8+ T-cell response frequency does not correlate with viral load. The red dots represent the total response summed across all functional combinations for each antigen for each progressor (n = 79). The x-axis denotes CD8+ T-cell frequency, and the y-axis denotes log10 viral RNA load. (D) The CD8+ T-cell response to HIV-Gag is composed of multiple functional subpopulations and is largely restricted to cell populations with limited functionality. The black bars represent the total CD8+ T-cell response frequency to Gag in subject A26 expressing the particular combination of functions shown. Each dot denotes CD107a, IFN-γ, MIP-1β, IL-2, and/or TNF-α positivity. The panel also contains horizontal bars of different colors showing those combinations of 5, 4, 3, 2, or 1 function for reference. Responses shown are background subtracted using the 28/49d negative control. (E) The functional profile of HIV-specific CD8+ T-cells is limited in HIV-infected progressors. Each pie chart represents the mean response across the 79 subjects to the 5 different HIV-antigen stimulations. For simplicity, responses are grouped by number of functions, matched to the colored bars in panel D. As shown, more than 75% of the average response to each antigen expresses fewer than 4 functions.
Figure 2.
Figure 2.
HIV-specific CD8+ T-cell functionality discriminates HIV-infected nonprogressors. (A) HIV Gag-specific CD8+ T-cell responses in HIV-infected nonprogressors are highly functional. The black bars represent the CD8+ T-cell response frequency to Gag in a representative nonprogressor (subject NP8) expressing the particular combination of functions shown. Each dot denotes CD107a, IFN-γ, MIP-1β, IL-2, and/or TNF-α positivity. The panel also contains horizontal bars of different colors showing those combinations of 5, 4, 3, 2, or 1 function for reference. Responses shown are background subtracted using the 28/49d negative control. (B) HIV-specific CD8+ T cells are highly functional in HIV-infected nonprogressors. Each pie chart represents the mean response across the 9 nonprogressors to the 5 different HIV-antigen stimulations. For simplicity, responses are grouped by number of functions, matched to the colored bars in panelA. As shown, responses with 5 functions can be detected to each HIV antigen in the nonprogressors, and a large proportion of the responding cells express 4 functions. (C) HIV-specific CD8+ T cells from nonprogressors (blue boxes) have a qualitatively different functional profile compared to progressors (red boxes). The box plots represent the 10th, 25th, 75th, and 90th percentiles of the proportion of the respective functional response toward the total CD8+ T-cell response against HIV Gag (left) or other HIV antigens (right panels). For simplicity, only the 5+ and 4+ populations lacking IL-2 production are shown for Pol, Env, Nef, and TRVVV responses; no differences were found for those functional combinations not shown. The responses from the cohorts were standardized so that the profiles could be compared irrespective of any frequency differences. Asterisks are placed above response pairs that are significantly different: ***P ≤ .001; **P ≤ .01. Marginal differences (P ≤ .05) are designated as a single asterisk. Each dot denotes a positive response for the function indicated at the bottom left.
Figure 3.
Figure 3.
The magnitude and proportion of the HIV-specific CD8+ T-cell response positive for all 5 functions is inversely correlated with viral load. Each dot represents data from a single progressor. The dotted line represents the linear regression (least-squares fit) line for predicting viral load based on the respective CD8+ T-cell response. Respective P values are shown in the top right of each graph. In the graphs, frequency refers to the magnitude of the antigen-specific response with a specific functional profile within the total CD8 pool, and percent refers to the proportion of the total antigen-specific response that bears a specific functional profile. The graphs depict: (A) frequency of 5+ Gag-specific cells versus viral load (slope =–30.6, r 2 = 0.15); (B) percent of Gag-specific response that is 5+ versus viral load (slope =–13.2, r 2 = 0.16); (C) percent of the total response (all antigens) that is 5+ versus viral load (slope =–23.8, r 2 = 0.19); (D) summed frequency of all 5+ responses from each antigen versus viral load (slope =–12.3, r 2 = 0.09); (E) the maximum frequency of any single 5+ response from any single antigen in each progressor versus viral load (each progressor is only represented by a single point; slope =–19.3, r 2 = 0.08); and (F) the percent of the Nef-specific response that is 5+ versus viral load (slope =–23.6, r 2 = 0.19). Note that the low r 2 values are primarily a function of the large number of values at 0 in the progressors, which cluster at higher viral loads.
Figure 4.
Figure 4.
Enhanced functionality in nonprogressors is not due to the presence of HLA-B57 or maintenance of central memory cells. (A) CMV-, EBV-, and influenzaspecific CD8+ T cells in the progressors are not restricted in functionality either off (left) or after initiation of ART (right). Each pie chart represents the average CD8+ T-cell response from a group of 5 progressors either prior to or after initiation of HAART. The colors correspond to the number of functions expressed, as shown. (B) HLA-B57+ (n = 6) and B57 (n = 3) nonprogressors were separated (left 2 pie charts), and the functionality of their HIV Gag-specific CD8+ T-cell responses compared with each other, and to HLA-B57+ (n = 6) and B57 (n = 6) progressors (right 2 pie charts). The colors in each pie chart correspond to the number of functions depicted by colored squares. (C) 5+ and (D) 4+ IL-2 responding cells can have varied memory phenotype. Twelve-color flow cytometry was performed to characterize the memory phenotype of responding CD8+ T cells. Plots depict CD8+ T cells responding with either the 5+ (red contours) or 4+IL-2 (orange contours) functional profile overlaid onto a density plot of the memory phenotype, as determined by CD27 and CD45RO, of the total CD8+ T-cell population. Inset in each plot is a histogram representing CD57 expression in the responding cells. (E) Initiation of ART does not improve CD8+ T-cell functionality in most individuals. Plots show the proportion of the total response against the indicated HIV peptide mix (indicated at top of each plot together with stimulus) prior to (OFF) and 6 to 12 months after (ON) initiation of ART. Each subject is represented by a colored line/symbol, and the symbols indicate the particular stimuli tested. The black box represents the mean response on or off therapy, with the SD of the mean shown as a black bar.

References

    1. Jin X, Bauer DE, Tuttleton SE, et al. Dramatic rise in plasma viremia after CD8(+) T cell depletion in simian immunodeficiency virus-infected macaques. J Exp Med. 1999;189: 991-998. - PMC - PubMed
    1. Schmitz JE, Kuroda MJ, Santra S, et al. Control of viremia in simian immunodeficiency virus infection by CD8+ lymphocytes. Science. 1999;283: 857-860. - PubMed
    1. Koup RA, Safrit JT, Cao Y, et al. Temporal association of cellular immune response with the initial control of viremia in primary HIV-1 syndrome. J Virol. 1994;68: 4650-4655. - PMC - PubMed
    1. Borrow P, Lewicki H, Hahn BH, Shaw GM, Oldstone MB. Virus-specific CD8+ cytotoxic T-lymphocyte activity associated with control of viremia in primary human immunodeficiency virus type 1 infection. J Virol. 1994;68: 6103-6110. - PMC - PubMed
    1. Goulder PJR, Phillips RE, Colbert RA, et al. Late escape from an immunodominant cytotoxic T lymphocytes response associated with progression to AIDS. Nat Med. 1997;3: 212-217. - PubMed

Publication types