. 2006 Apr;17(4):2057-68.
doi: 10.1091/mbc.e05-06-0526. Epub 2006 Feb 8.

Kinesin-1 and Dynein are the primary motors for fast transport of mitochondria in Drosophila motor axons

Affiliations

Kinesin-1 and Dynein are the primary motors for fast transport of mitochondria in Drosophila motor axons

Aaron D Pilling et al. Mol Biol Cell. 2006 Apr.

Abstract

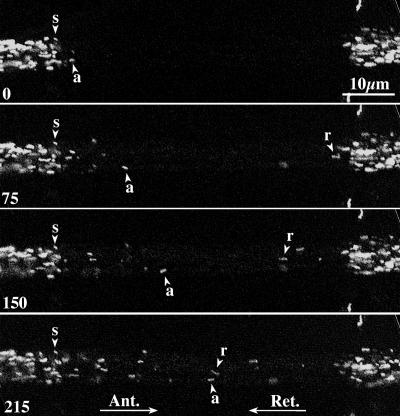
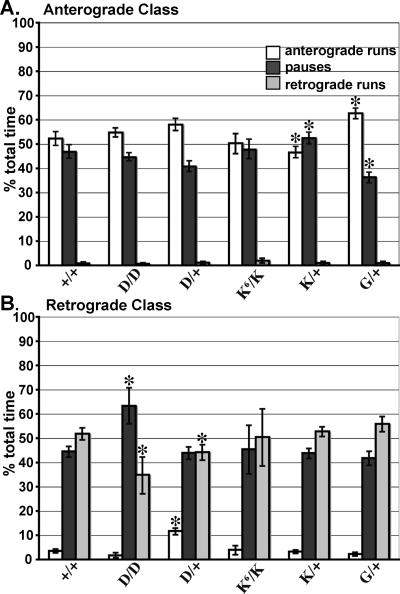
To address questions about mechanisms of filament-based organelle transport, a system was developed to image and track mitochondria in an intact Drosophila nervous system. Mutant analyses suggest that the primary motors for mitochondrial movement in larval motor axons are kinesin-1 (anterograde) and cytoplasmic dynein (retrograde), and interestingly that kinesin-1 is critical for retrograde transport by dynein. During transport, there was little evidence that force production by the two opposing motors was competitive, suggesting a mechanism for alternate coordination. Tests of the possible coordination factor P150(Glued) suggested that it indeed influenced both motors on axonal mitochondria, but there was no evidence that its function was critical for the motor coordination mechanism. Observation of organelle-filled axonal swellings ("organelle jams" or "clogs") caused by kinesin and dynein mutations showed that mitochondria could move vigorously within and pass through them, indicating that they were not the simple steric transport blockades suggested previously. We speculate that axonal swellings may instead reflect sites of autophagocytosis of senescent mitochondria that are stranded in axons by retrograde transport failure; a protective process aimed at suppressing cell death signals and neurodegeneration.


Figures

Figure 1.
Figure 1.
Fluorescence pattern of mitoGFP expressed by the D42 driver. (A) A composite image of a fixed third instar neuromuscular preparation from a larva homozygous for both the D42 Gal4 driver and mitoGFP. GFP fluorescence was strong in the presumptive optic lobes and ventral ganglion (VG), segmental nerves (SN), and neuromuscular junctions (NMJ). In this specimen, the ventral ganglion is lying on its side with optic lobes projecting down. Abdominal segments A2 and A6 are indicated. (B) A high-magnification view of a portion of a single segmental nerve passing through segment A4. Single axonal mitochondria usually were elongated (arrow) but some were small and spherical. Anterior is to the left in this, and all subsequent figures.
Figure 2.
Figure 2.
Transport of GFP-mitochondria in wild-type motor axons. A series of confocal images from a time-lapse movie of mitoGFP in motor axons of a segmental nerve in a dissected third instar (see Supplemental Video 2). The central ∼50-μm region was photobleached and then imaged at the times indicated (seconds). Anterograde (Ant.) and retrograde (Ret.) directions are indicated by arrows. Stationary mitochondria (s) are evident outside the bleached zone. Anterograde mitochondria (a) entered the bleached zone from the left boundary and retrograde mitochondria (r) entered from the right.
Figure 3.
Figure 3.
Comparison of transport parameters for anterograde and retrograde mitochondria. (A and B) The positions of 10 randomly selected anterograde and retrograde mitochondria from nerves in five different wild-type larvae were plotted as a function of time. The starting position for each mitochondrion is arbitrary, selected to allow a clear view of each trace. Transport in both directions consisted of forward runs separated by pauses, short reverse runs, or both. Note the steeper but less regular slopes of the retrograde class of organelles. (C and D) The frequency distributions of forward run lengths (bins, 0.25 μm) and velocities (bins, 0.05 μm/s) for anterograde and retrograde mitochondria are shown. Note the clear bias of the anterograde class toward shorter, slower runs.
Figure 4.
Figure 4.
Dynein mutations disrupt retrograde transport of mitochondria. (A) A series of confocal images from a time-lapse movie of mitochondria in motor axons of a larva carrying Dhc64C6-10/Dhc64C4-19 (Supplemental Video 3). Note that the number of retrograde mitochondria (r) that entered the photobleached zone was substantially reduced relative to anterograde mitochondria (a). A stationary mitochondrion (s) near the anterior bleach boundary is marked for reference. (B) Frequency distributions are plotted for two forward run parameters of the five retrograde mitochondria that entered bleached zones in 10 different Dhc64C mutant larvae (gray bars). Black line-tracings show analogous frequencies for wild-type mitochondria. Note that despite the small sample size from mutants, a significant shift to shorter retrograde runs is evident (p < 0.05; see Table 1).
Figure 5.
Figure 5.
Effects of dynein, kinesn-1 and dynactin mutations on anterograde and retrograde flux of mitochondria. The mean numbers (±SD) of anterograde or retrograde mitochondria entering bleach zones per minute are shown for the following genotypes: +/+, wild-type (n = 11 larvae); D/D, Dhc64C6-10/Dhc64C4-19 (n = 5); D/+, Dhc64C4-19/+ (n = 5); K6/K, Khc6/Khc27 (n = 5); K17/K, Khc17/Khc27 (n = 3); K/+, Khc27/+ (n = 10); and G/+, Gl1/+ (n = 5). Note that flux is a compound parameter determined by net organelle velocities, the abundance of organelles in axons, and by the fraction of axonal organelles moving in a given direction. Numerical values are shown in Table 1 and Supplemental Table s1. To determine whether flux values were significantly different from wild type, one-way descriptive statistic linear contrast tests using aggregated larval data were used. Means showing a genotype by genotype contrast with p < 0.05 were accepted as significantly different from wild type (*).
Figure 6.
Figure 6.
Effects of dynein, kinesn-1, and dynactin mutations on anterograde and retrograde class duty cycles. The percentage of time spent in anterograde runs, pauses, and retrograde runs for anterograde and retrograde class mitochondria are shown for the following genotypes: +/+, wild-type (for both A and B, n = 52 mitochondria in 5 larvae); D/D, Dhc64C6-10/Dhc64C4-19 (for A, n = 92 and 5; for B, n = 11 and 5); D/+, Dhc64C4-19/+ (for A, n = 44 and 5; for B, n = 43 and 5); K6/K, Khc6/Khc27 (for A, n = 24 and 4; for B, n = 5 and 4); K/+, Khc27/+ (for A, n = 85 and 5; for B, n = 118 and 5); and G/+) Gl1/+ (for A, n = 94 and 5; for B, n = 64 and 5). Bars show SEs. Values can be found in Table 1 and Supplemental Table s1. Means showing a genotype by genotype contrast significance of p ≤ 0.05 compared with wild type are noted by an asterisk.
Figure 7.
Figure 7.
Mutations in kinesin and dynein affect the distribution of mitochondria in segmental nerves. (A) Single confocal optical sections of GFP-mitochondria in motor axons of segmental nerve A8 in live preparations. Imaging parameters were identical for all preparations. Images from the anterior segment A2, proximal to motoneuron cell bodies (Prox.), and from the posterior segment A7, distal to the cell bodies (Dist.), are shown. (B) To quantify the effects of Khc and Dhc64C mutations on the number of mitochondria in proximal and distal regions, fluorescence intensity per unit area was measured in proximal and distal regions of A8 nerves from three larvae for each genotype (n = 20 proximal and 20 distal measurements/larva, 34.5 μm2/measurement). Bars show mean intensity values (±SD). Means significantly different from wild type (p < 0.05) are noted with an asterisk. Bar (A), 10 μm.
Figure 8.
Figure 8.
Cofractionation of dynein, kinesin-1 and dynactin components with neuronal mitochondria. Cytoplasm containing mitochondria from adult flies homozygous for D42 and mitoGFP was initially fractionated by differential sedimentation (Supplemental Figure s3) and then fractionated further by equilibrium density gradient centrifugation. Western blots of gradient fractions are shown stained with antibodies specific for cytoplasmic dynein (Dhc), kinesin-1 (Khc), and the dynactin components P150Glued (p150) and p50/dynamitin (p50). Fractions containing mitochondria were identified by anti-GFP and anti-cytochrome c (CytC) staining.

References

    1. Abeliovich, H., and Klionsky, D. J. (2001). Autophagy in yeast: mechanistic insights and physiological function. Microbiol. Mol. Biol. Rev. 65, 463-479. - PMC - PubMed
    1. Bowman, A. B., Patel-King, R. S., Benashski, S. E., McCaffery, J. M., Goldstein, L.S.B., and King, S. M. (1999). Drosophila roadblock and Chlamydomonas LC7: a conserved family of dynein-associated proteins involved in axonal transport, flagellar motility, and mitosis. J. Cell Biol. 146, 165-180. - PMC - PubMed
    1. Brady, S. T., Pfister, K. K., and Bloom, G. S. (1990). A monoclonal antibody against kinesin inhibits both anterograde and retrograde fast axonal transport in squid axoplasm. Proc. Natl. Acad. Sci. USA 87, 1061-1065. - PMC - PubMed
    1. Brand, A. H., and Perrimon, N. (1993). Targeted gene expression as a means of altering cell fates and generating dominant phenotypes. Development 118, 401-415. - PubMed
    1. Brendza, K. M., Rose, D. J., Gilbert, S. P., and Saxton, W. M. (1999). Lethal kinesin mutations reveal amino acids important for ATPase activation and structural coupling. J. Biol. Chem. 274, 31506-31514. - PMC - PubMed

Publication types

MeSH terms