. 2006 Feb 8;26(6):1677-87.
doi: 10.1523/JNEUROSCI.3664-05.2006.

Single Ih channels in pyramidal neuron dendrites: properties, distribution, and impact on action potential output

Affiliations

Single Ih channels in pyramidal neuron dendrites: properties, distribution, and impact on action potential output

Maarten H P Kole et al. J Neurosci. .

Abstract

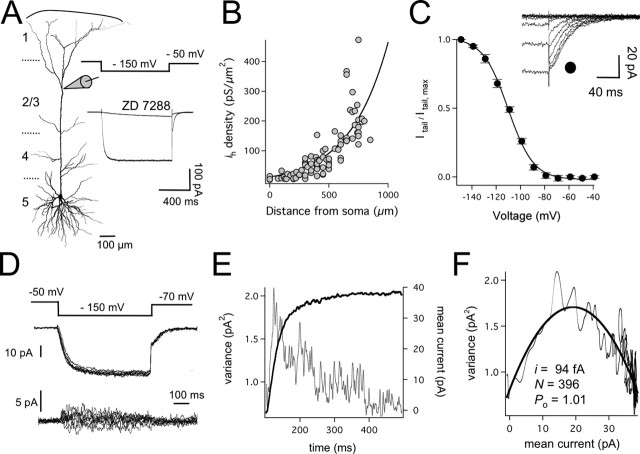
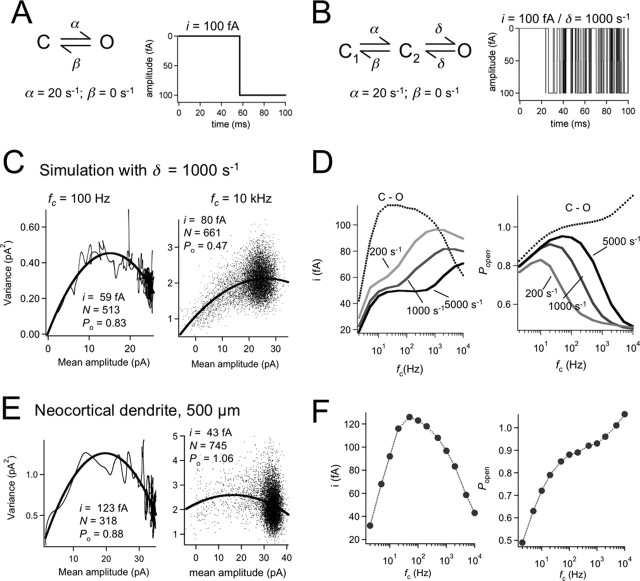
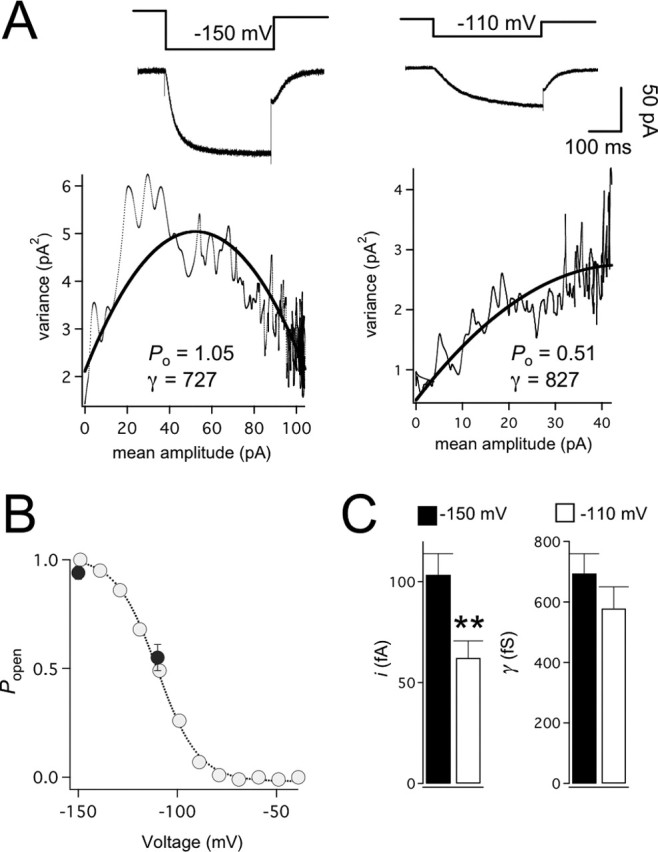
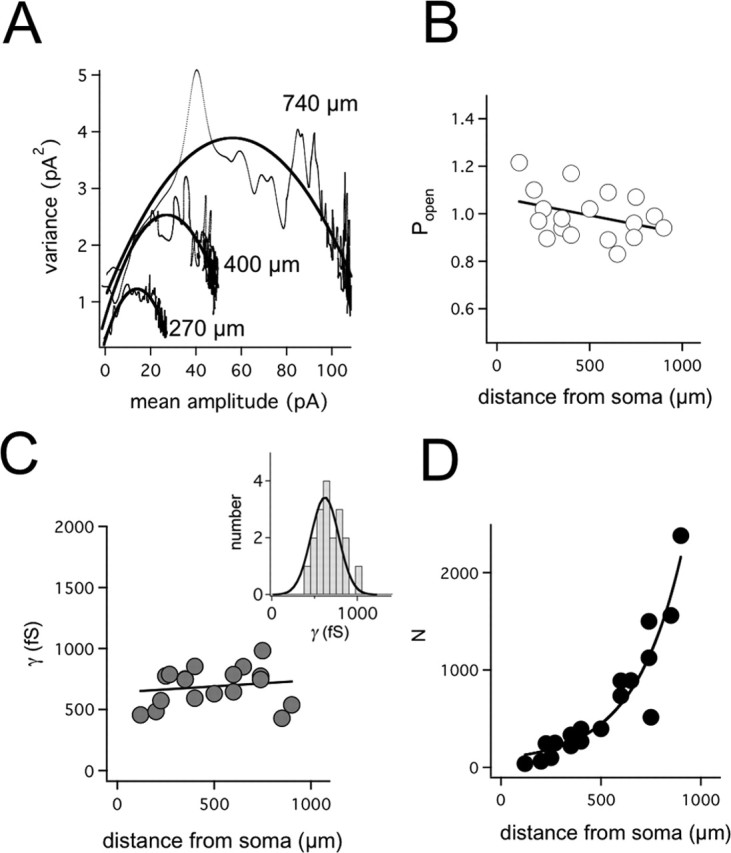
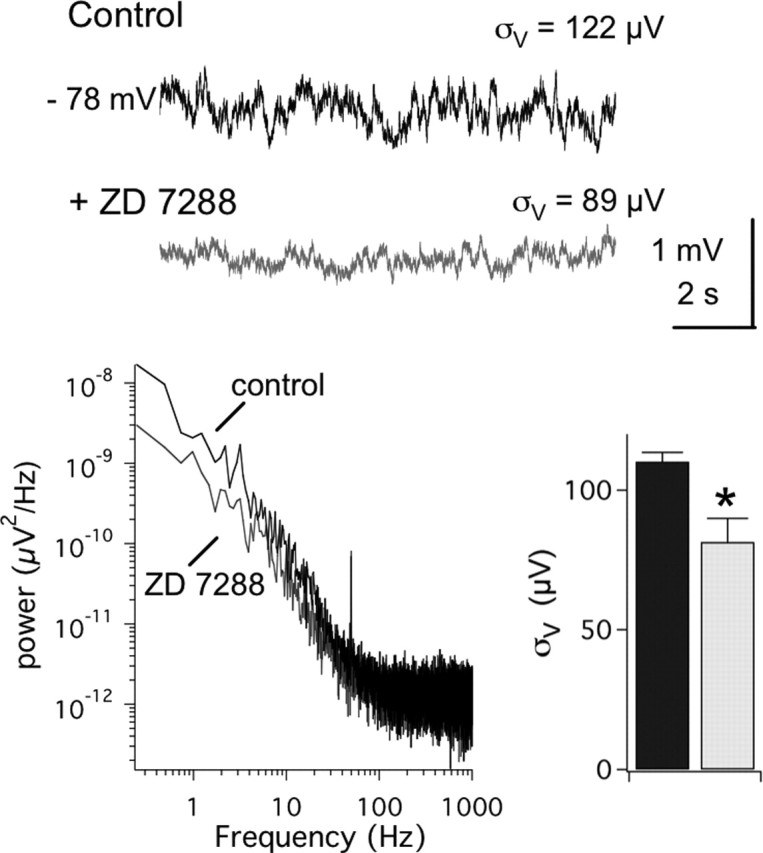
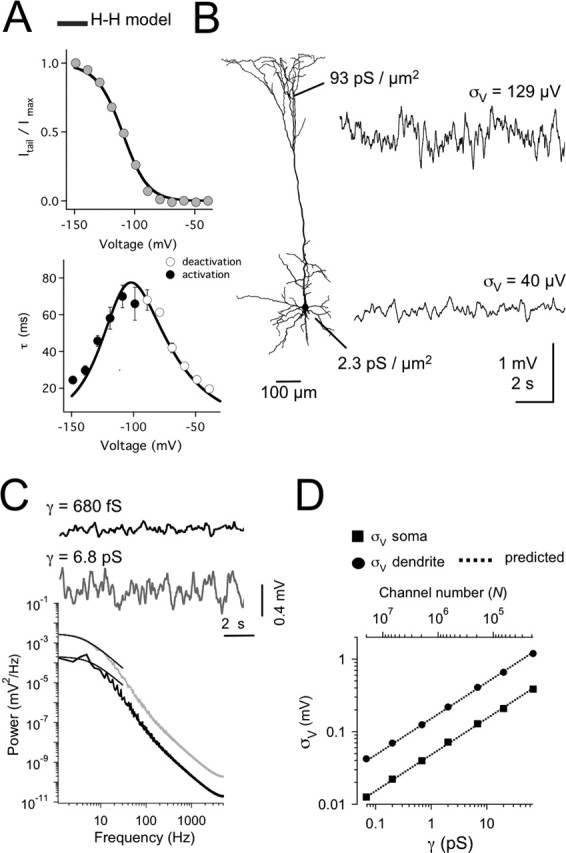
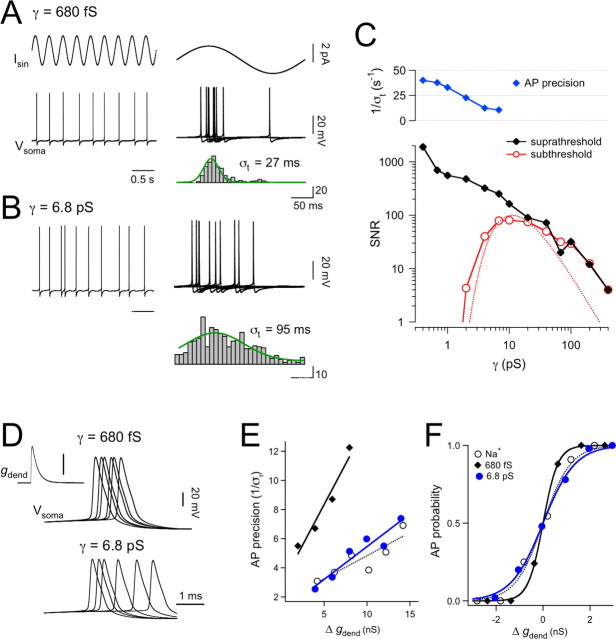
The hyperpolarization-activated cation current (Ih) plays an important role in regulating neuronal excitability, yet its native single-channel properties in the brain are essentially unknown. Here we use variance-mean analysis to study the properties of single Ih channels in the apical dendrites of cortical layer 5 pyramidal neurons in vitro. In these neurons, we find that Ih channels have an average unitary conductance of 680 +/- 30 fS (n = 18). Spectral analysis of simulated and native Ih channels showed that there is little or no channel flicker below 5 kHz. In contrast to the uniformly distributed single-channel conductance, Ih channel number increases exponentially with distance, reaching densities as high as approximately 550 channels/microm2 at distal dendritic sites. These high channel densities generate significant membrane voltage noise. By incorporating a stochastic model of Ih single-channel gating into a morphologically realistic model of a layer 5 neuron, we show that this channel noise is higher in distal dendritic compartments and increased threefold with a 10-fold increased single-channel conductance (6.8 pS) but constant Ih current density. In addition, we demonstrate that voltage fluctuations attributable to stochastic Ih channel gating impact on action potential output, with greater spike-timing precision in models with the experimentally determined single-channel conductance. These data suggest that, in the face of high current densities, the small single-channel conductance of Ih is critical for maintaining the fidelity of action potential output.


Figures

Figure 1.
Figure 1.
Ih current distribution, kinetics, and single-channel properties. A, Schematic of the experimental setup during dendritic cell-attached recording 700 μm from the soma of a layer 5 pyramidal neuron (reconstructed from a biocytin fill). The different cortical layers are indicated. An example of Ih current evoked by a 100 mV hyperpolarizing pulse from a holding potential 25 mV depolarized from rest is shown before and after bath application of ZD 7288 (50 μm). B, Ih current density plotted against distance from the soma (n = 88). Data fitted with a single-exponential function. C, Ih voltage-activation curve generated from tail currents (inset) during hyperpolarizing steps between −40 and −150 mV (n = 9; 680 ± 21 μm from the soma). Data fitted with a Boltzmann function. D, Superimposed successive single traces used for NSFA elicited by a 100 mV hyperpolarizing step (recorded 500 μm from the soma). Only 10 of 100 traces are shown. The corresponding subtracted differences from the 10 traces are given in the bottom panel. Currents were off-line digitally filtered at 100 Hz. E, Fluctuation analysis of data in D. Data of 100 successive sweeps were used to plot mean Ih current (black trace) and variance (gray trace) as a function of time. F, Variance-mean plot for the data in E. The data were well fitted by a parabola (black line) from which the single-channel amplitude i, the maximum number of channels N, and the open probability Po were obtained.
Figure 2.
Figure 2.
Accuracy of parameters extracted with NSFA. A, Ih channels simulated with a simple gating model. The rate from the closed (C) to the open (O) state was set to be 20 s−1, and Po was set to 1. The right panel shows an example of a simulated single-channel trace with amplitude i of 100 fA. B, Flickering Ih channels were simulated by adding an additional shut state C2 to the scheme used in A. The rate into and out of the open state, δ, was equal, leading to Po = 0.5. The other channel rates are not changed. The right panel shows an example of a simulated single-channel trace with the flicker frequency δ set to 1000 s−1. For clarity, only 100 ms of the 400 ms trace is shown. C, Examples of variance-mean plots of simulated Ih channels with δ set to 1000 s−1 using a filter cutoff frequency, fc, of 100 Hz (left) and 10 kHz (right). The parameters obtained from NSFA fitting (black lines) are indicated. D, The influence of filtering on the parameters extracted with NSFA was investigated systematically by varying fc from 2 Hz to 10 kHz. The lines represent simulations with different flickering frequencies (δ ranging from 200 to 5000 Hz). With increasing flickering frequency, higher cutoff frequencies are required to extract the correct parameters using NSFA. The dotted lines represent the parameters obtained with the nonflickering C–O model. E, Variance-mean plots for experimental data recorded 500 μm from the soma and low-pass filtered at 100 Hz (left) or 10 kHz (right). The parameters obtained from NSFA are indicated. F, The single-channel parameters i, N, and Po are plotted versus fc for the experimental data shown in E. Note the high similarity to the nonflickering model (C–O) shown in D.
Figure 3.
Figure 3.
Voltage-dependent properties of Ih obtained with NSFA. A, Top, Ih currents evoked by hyperpolarizing steps to −150 mV (left) and −110 mV (right). Bottom, Fitting variance versus mean of the plots (black line) yielded a Po of 1.05 with 889 channels and i of 109 fA during steps to −150 (left), whereas Po was reduced to 0.51 and i to 91 fA during steps to −110 mV (right). N was fixed to that obtained during steps to −150 mV (889) during fitting of the NSFA data for steps to −110 mV (black line). B, Pooled data (n = 5) of Po during steps to −150 mV (0.94 ± 0.03) and −110 mV (0.54 ± 0.05; filled circles) is consistent with the activation curves obtained from Ih tail-current amplitudes (open circles; same data as in Fig. 1C). C, Histogram of single-channel current amplitude i (left) and conductance γ (right) extracted with NSFA during steps to −150 and −110 mV. **p < 0.001 (n = 6).
Figure 4.
Figure 4.
NSFA reveals a distance-dependent increase in N. A, Superimposed examples of variance-mean plots for three dendritic locations (270, 400, and 740 μm from the soma) with the variance-mean fits (black lines). B, Plot of open probability Po versus recording distance from the soma. Data were fitted with a regression (slope of −0.015; n = 18). C, Plot of single-channel conductance γ versus distance from the soma. Data fitted with a linear regression (slope of +0.11; n = 18). Inset shows a histogram of γ revealing a single population well fitted with a Gaussian function (n = 18). D, Plot of the number of channels per patch (N) versus distance (d) from the soma. The data are well described by a single-exponential function of the form: 49 × exp(d/240) + 47, indicating that the Ih channel number increases e-fold for a 240 μm change in distance.
Figure 5.
Figure 5.
Impact of Ih channel gating on somatic voltage noise. Whole-cell somatic voltage recordings before (top trace; black) and after (bottom trace; gray) Ih channel block by bath application of ZD 7288 (50 μm). All data were recorded in the presence of synaptic blockers and TTX. DC injection was used to maintain the same membrane potential in control and ZD 7288. Left, Power spectrum of the same traces indicating that ZD 7288 attenuates voltage fluctuations in the low-frequency range. Right, Population data of the average SD, σV, of the somatic voltage noise in control (black bar) and ZD 7288 (gray bar).
Figure 6.
Figure 6.
Impact of Ih channel single-channel conductance on voltage noise in a model. A, Modeling of Ih kinetics using Hodgkin–Huxley (H–H) formalism. Steady-state voltage-activation curve (top) and the voltage dependence of activation (weighted single time constant; filled circles, bottom) and deactivation (open circles) together with the predictions from the Hodgkin–Huxley Ih model (lines). B, Left, Morphology of the compartmental layer 5 neuron. Conductance densities at the soma and a distal dendritic location, together with representative examples (right) of the resting membrane potential at the soma (−79 mV; bottom trace) and distal dendrites (−63 mV; 1000 μm from the soma; top trace) using a model with single-channel conductance γ of 680 fS. C, The power of somatic membrane potential fluctuations versus frequency for models with γ of 680 fS (black) and 6.8 pS (gray). Data fitted with a Lorentzian function (see Materials and Methods) from 1 to 30 Hz giving a cutoff frequency fc of 6.0 and 4.2 Hz, respectively, in the models with γ of 680 fS and 6.8 pS. D, The SD of the resting membrane potential σV plotted against γ and total N used in the simulations. The squares represent σV at the soma and the circles σV at a dendritic position 1000 μm from the soma. The lines are the predicted relationship between σV and γ (see Materials and Methods).
Figure 7.
Figure 7.
Impact of Ih single-channel noise on the fidelity of AP output in the model. A, Somatic injection of a small suprathreshold sinusoidal current signal (Isin = 4 pA; 3 Hz; top trace) elicited, on average, one AP per sine-wave cycle (bottom trace) in a model with γ of 680 fS. Right, Superimposed responses on an expanded time scale. Bottom, Histogram of AP onset latency relative to the phase of the sine wave for 400 consecutive sine-wave cycles. Data were fitted with a Gaussian function (green line) with SD σt. B, Corresponding plots as in A but with increased γ to 6.8 pS. Note the threefold increase in AP jitter. C, SNR determined from the 3 Hz peak in the power-spectrum density, and temporal precision (blue diamonds, 1/σt) are plotted as a function of γ (range, 0.4–400 pS). Subthreshold sinusoidal current injections (red; Isin = 4 pA) and suprathreshold injections (black; Isin = 4 pA) were analyzed for stochastic resonance. The dotted lines are fits according to stochastic resonance theory (see Materials and Methods). D, Superimposed sweeps of APs evoked by a simulated excitatory synaptic conductance (gdend; left trace; calibration bar, 60 nS) injected 400 μm from the soma in models with single-channel conductance γ of 680 fS (top) and 6.8 pS (bottom). Note the larger trial-to-trial variability (jittering) in models with large γ. E, Spike precision defined as 1/σ and plotted versus the change in amplitude of the excitatory synaptic conductance in models with γ of 680 fS (black diamonds) and 6.8 pS (blue circles). For comparison, a model with deterministic Ih and stochastic Na+ channels with γNa = 10 pS is shown (open circles). F, Input–output relationship showing the probability of AP generation versus the change in amplitude of the excitatory synaptic conductance in models with γ = 680 fS (black line; steepness of the sigmoid fit, s = 0.31 nS) and γ = 6.8 pS (blue line; s = 0.68 nS). For comparison, a model with deterministic Ih and stochastic Na+ channels with γNa = 10 pS is shown (open circles; s = 0.59 nS).

Similar articles

Cited by

References

    1. Alvarez O, Gonzalez C, Latorre R (2002). Counting channels: a tutorial guide on ion channel fluctuation analysis. Adv Physiol Educ 26:327–341. - PubMed
    1. Berger T, Larkum ME, Luscher H-R (2001). High Ih channel density in the distal apical dendrite of layer V pyramidal cells increases bidirectional attenuation of EPSPs. J Neurophysiol 85:855–868. - PubMed
    1. Biel M, Schneider A, Wahl C (2002). Cardiac HCN channels: structure, function, and modulation. Trends Cardiovasc Med 12:206–212. - PubMed
    1. BoSmith RE, Briggs I, Sturgess NC (1993). Inhibitory actions of ZENECA ZD7288 on whole-cell hyperpolarization activated inward current (If) in guinea-pig dissociated sinoatrial node cells. Br J Pharmacol 110:343–349. - PMC - PubMed
    1. Brown HF, DiFrancesco D, Noble SJ (1979). How does adrenaline accelerate the heart? Nature 280:235–236. - PubMed

Publication types

LinkOut - more resources