. 2006 Feb 8;26(6):1739-48.
doi: 10.1523/JNEUROSCI.3677-05.2006.

Block of inferior olive gap junctional coupling decreases Purkinje cell complex spike synchrony and rhythmicity

Affiliations

Block of inferior olive gap junctional coupling decreases Purkinje cell complex spike synchrony and rhythmicity

Timothy A Blenkinsop et al. J Neurosci. .

Abstract

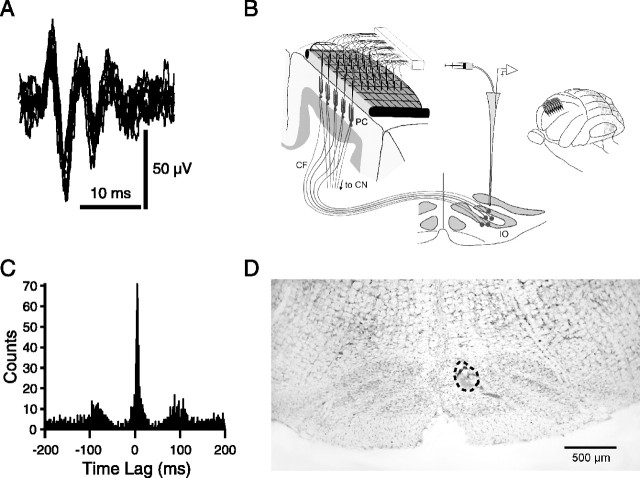
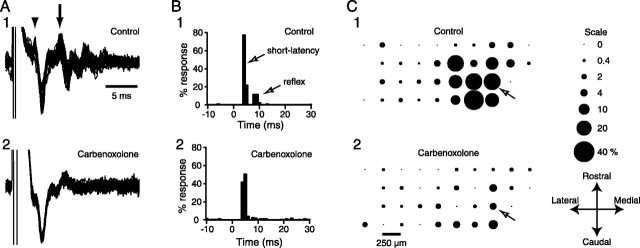
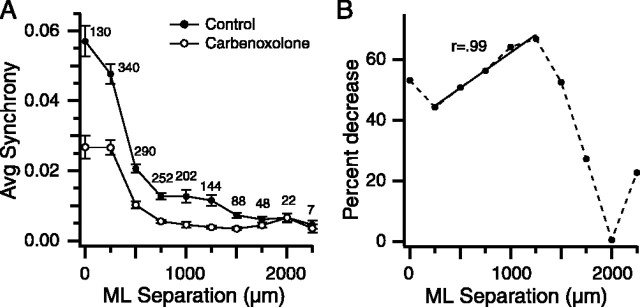
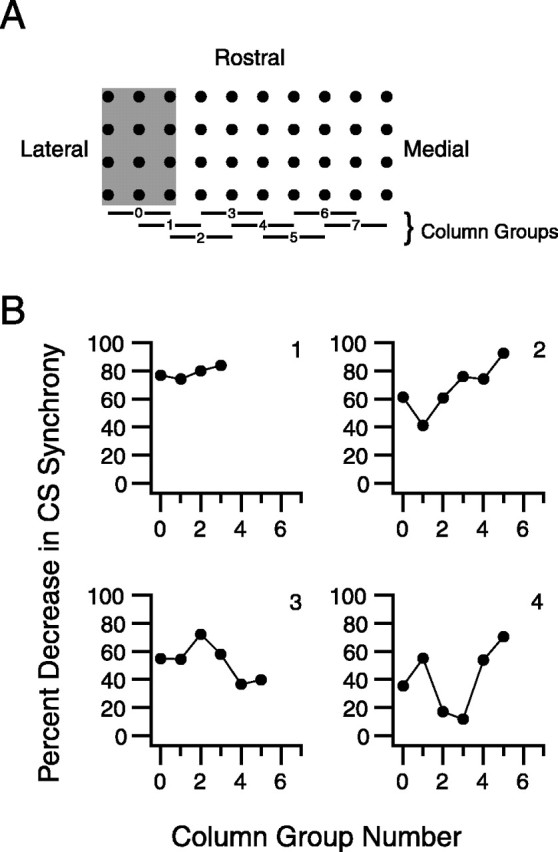
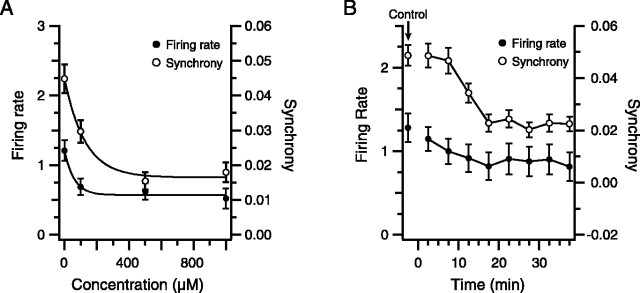
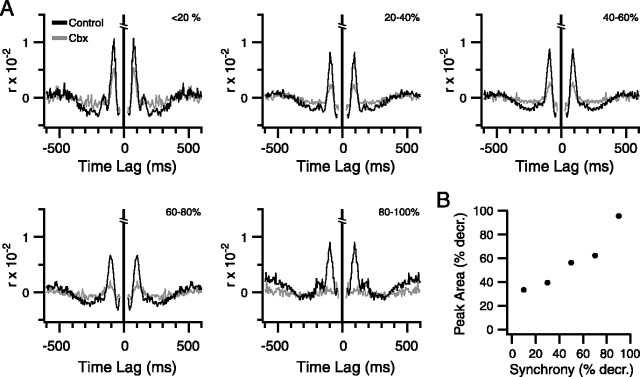
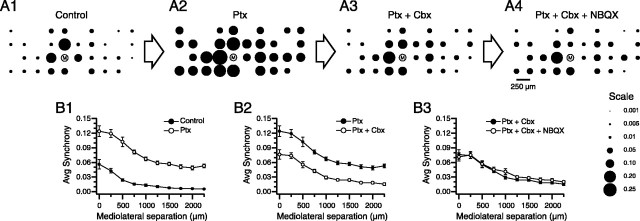
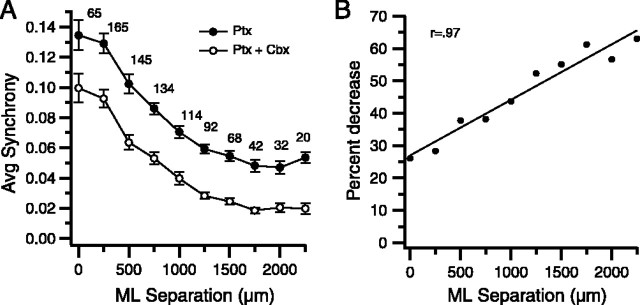
Inferior olivary (IO) neurons are electrotonically coupled by gap junctions. This coupling is thought to underlie synchronous complex spike (CS) activity generated by the olivocerebellar system in Purkinje cells, and also has been hypothesized to be necessary for IO neurons to generate spontaneous oscillatory activity. These characteristics of olivocerebellar activity have been proposed to be central to the role of this system in motor coordination. However, the relationship of gap junction coupling between IO neurons to synchronous and rhythmic CS activity has never been directly tested. Thus, to address this issue, multiple electrode recordings were obtained from crus 2a Purkinje cells, and carbenoxolone, a gap junction blocker, was injected into the IO. Carbenoxolone reduced CS synchrony by 50% overall, but in some experiments, >80% reductions were achieved. Carbenoxolone also reduced the average firing rate by 50%, suggesting that electrical coupling is a significant source of excitation for IO neurons. Moreover, carbenoxolone caused a reduction in the approximately 10 Hz rhythmicity of CS activity, and this reduction was correlated with the extent to which the injection reduced CS synchrony. Lastly, carbenoxolone was found to reverse or prevent changes in synchrony that are normally induced by injection of GABAA and glutamate receptor antagonists into the IO, suggesting that the effects of these drugs on CS synchrony patterns require electrical coupling of IO neurons. In sum, our results provide direct evidence that electrical coupling of IO neurons underlies synchronous CS activity, and suggest important roles for this coupling in shaping other aspects of IO spiking patterns.


Figures

Figure 1.
Figure 1.
Experimental design and characteristics of spontaneous Purkinje cell CS activity. A, Overlaid traces of extracellularly recorded CS activity from one Purkinje cell. B, Schematic of the experimental setup showing implantation of electrodes through an electron microscope grid and into the molecular layer of the cerebellar cortex. A pipette is inserted into the contralateral IO to make local injections. Inset shows the approximate location of electrode array on crus 2a. C, IO–CS cross-correlogram. Spikes from IO single unit served as the reference for generating correlogram. CSs recorded from one cell in the crus 2a recording array. D, Cresyl violet-stained coronal section of the brainstem. Injection location within medial IO is marked by alcian blue dye that was injected at the end of the experiment. The injection site is encircled by a dashed line. CF, Climbing fiber; PC, Purkinje cell; CN, cerebellar nuclei.
Figure 2.
Figure 2.
Intra-IO injection of carbenoxolone blocks the climbing fiber reflex. A, Responses evoked by cerebellar white matter stimulation before (A1) and after (A2) carbenoxolone administration. A1, Ten overlapped traces showing responses in control condition that have both short-latency (arrowhead) and reflex (arrow) components. Initial deflection is stimulus artifact. A2, Responses to an identical strength stimulus during intra-IO injection of carbenoxolone. Short-latency response is present, but reflex response is no longer elicited. B, Peristimulus histogram of cell in A showing the short-latency (∼4 ms) and reflex responses (∼8–12 ms) in control (B1) and during carbenoxolone (B2) to ∼300 stimuli. Bin size, 1 ms. C, Bubble representation of climbing fiber reflex response in control (C1) and during carbenoxolone (C2) across the entire recording array. The bubble size reflects the percentage of responses to ∼300 stimuli according to the scale on the right. The key at the bottom right indicates the orientation of the array on crus 2a. The arrow indicates the location of the cell whose histograms are shown in B.
Figure 3.
Figure 3.
Intra-IO carbenoxolone reduces CS synchrony levels. A, Average CS synchrony calculated from all cell pairs in all experiments and plotted as a function of the mediolateral (ML) distance between the cells in a pair. The number above each data point indicates the number of cell pairs at that separation. Error bars are SE. B, Percent decrease in synchrony from control levels caused by carbenoxolone injection plotted as a function of mediolateral separation between cells. Solid line, Least-squares regression line to points at 250–1250 μm separations. Pearson’s r (=0.98) indicates correlation coefficient for the x and y variables for the data in the same range.
Figure 4.
Figure 4.
Intraexperiment variation in the effect of carbenoxolone on synchrony. A, B, Synchrony distribution with respect to two reference cells labeled “M” from the same experiment. Bubble plot representations of the synchrony distributions are shown for each cell in control (A1, B1) and during injection of carbenoxolone into the IO (A2, B2). The cell in A shows only a modest decrease in synchrony, whereas that in B shows a near-complete desynchronization. A3, B3, Plots of average CS synchrony as a function of mediolateral separation between cells. Average synchrony is plotted for all cell pairs that include the reference cell shown in the corresponding bubble plots. Note that the curves in A3 end at 1250 μm because the reference cell is located in the middle of the array, and this value corresponds to the distance from the reference cell to the farthest (lateral) border of the array. Error bars are SE. ML, Mediolateral.
Figure 5.
Figure 5.
Intercolumn variation of the effect of carbenoxolone on synchrony. A, Black dots represent electrode positions in a 4 × 10 recording array, which is shown to illustrate the analysis procedure. Electrodes were grouped into sets of three adjacent rostrocaudally running columns. Average synchrony was then calculated for each cell group using all of its cell pairs. Horizontal bars show column groupings that were used. The bar numbers correspond to the abscissa values in the plots in B. The lateralmost group, group 0, is indicated by the gray rectangle. B, Plots of percent decrease in CS synchrony with carbenoxolone as a function of rostrocaudal column location on recording array. Each plot shows the results from a single experiment.
Figure 6.
Figure 6.
Dose–response and time course curves for the effect of carbenoxolone on CS activity. A, Dose–response curves were obtained by plotting average firing rate (left axis, filled circles) and synchrony (right axis, open circles) as a function of carbenoxolone concentration. Zero concentration points represent control values before start of injection. At each concentration, carbenoxolone was injected for 40 min before recording CS activity for 20 min. Injection solutions were switched with the pipette remaining in place in the IO. In this experiment, 24 cells were simultaneously recorded. Curves are least-squares fits to the data. B, Time course of the effect of carbenoxolone. The plot shows average firing rate and synchrony as a function of time after start of injection for an experiment in which 19 cells were recorded simultaneously. Each data point represents a 5 min recording period centered about the x-coordinate of the point, except for the control points (arrow), which were obtained from a 20 min recording before the start of the injection. Error bars in A and B are SE.
Figure 7.
Figure 7.
Carbenoxolone injection reduces CS rhythmicity: comparison across cell groups. A, Cells from all experiments were grouped according to their percent decrease in synchrony. Population autocorrelograms are shown for each of the groups, with the group ranges indicated in top right of each correlogram. The control correlograms are shown in black; the carbenoxolone (Cbx) correlograms are in gray. B, Plot of percent decrease in synchrony versus percent decrease in primary autocorrelogram peak area between control and carbenoxolone for the same synchrony groups as in A. Midpoints of synchrony ranges were used for abscissa values.
Figure 8.
Figure 8.
Picrotoxin- and NBQX-induced changes in synchrony are antagonized by carbenoxolone. A, Bubble plots showing CS synchrony with respect to a reference cell (labeled “M”) in a sequence of experimental conditions in which drugs were injected into the IO. From left to right, the drug combinations listed above the bubble plot were injected into the IO. Ptx, Picrotoxin; Cbx, carbenoxolone. The synchrony scale is in the bottom right corner. B, Plots of average synchrony as a function of mediolateral separation between cells. All cell pairs from the array shown in the top row (not just those pairs containing cell M) were used to generate the plots. Each plot shows the synchrony curves for two successive conditions: B1 shows traces corresponding to A1 and A2 conditions; B2 shows traces for A2 and A3 conditions; and B3 shows traces for A3 and A4 conditions. Error bars are SE.
Figure 9.
Figure 9.
Intra-IO carbenoxolone lowers picrotoxin-enhanced synchrony. A, Average CS synchrony calculated from all cell pairs in all experiments and plotted as a function of the mediolateral distance between the cells in a pair for picrotoxin (Ptx) and picrotoxin plus carbenoxolone (Ptx + Carb) conditions. The number above each data point indicates the number of cell pairs at that separation. Error bars are SE. B, Percent decrease in synchrony from picrotoxin-alone condition caused by addition of carbenoxolone to the injection solution plotted as a function of mediolateral separation between cells. The solid line is least-squares regression line. ML, Mediolateral.

References

    1. Bal T, McCormick DA (1997). Synchronized oscillations in the inferior olive are controlled by the hyperpolarization-activated cation current Ih J Neurophysiol 77:3145–3156. - PubMed
    1. Bell CC, Kawasaki T (1972). Relations among climbing fiber responses of nearby Purkinje cells. J Neurophysiol 35:155–169. - PubMed
    1. Belluardo N, Mudò G, Travato-Salinaro A, Le Gurun S, Charollais A, Serre-Beinier V, Amato G, Haefliger J-A, Meda P, Condorelli DF (2000). Expression of connexin36 in the adult and developing rat brain. Brain Res 865:121–138. - PubMed
    1. Benardo LS, Foster RE (1986). Oscillatory behavior in inferior olive neurons: mechanisms, modulation, cell aggregates. Brain Res Bull 17:773–784. - PubMed
    1. Bleasel AF, Pettigrew AG (1992). Development and properties of spontaneous oscillations of the membrane potential in inferior olivary neurons in the rat. Brain Res Dev Brain Res 65:43–50. - PubMed

Publication types

LinkOut - more resources