. 2006 Feb 8;26(6):1833-43.
doi: 10.1523/JNEUROSCI.4584-05.2006.

Disinhibition opens the gate to pathological pain signaling in superficial neurokinin 1 receptor-expressing neurons in rat spinal cord

Affiliations

Disinhibition opens the gate to pathological pain signaling in superficial neurokinin 1 receptor-expressing neurons in rat spinal cord

Carole Torsney et al. J Neurosci. .

Abstract

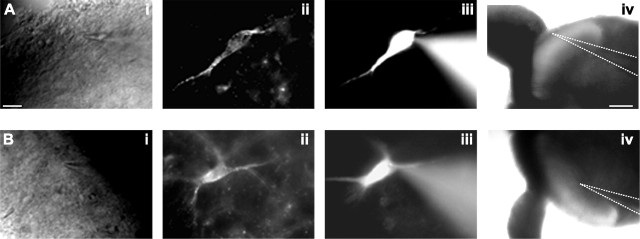
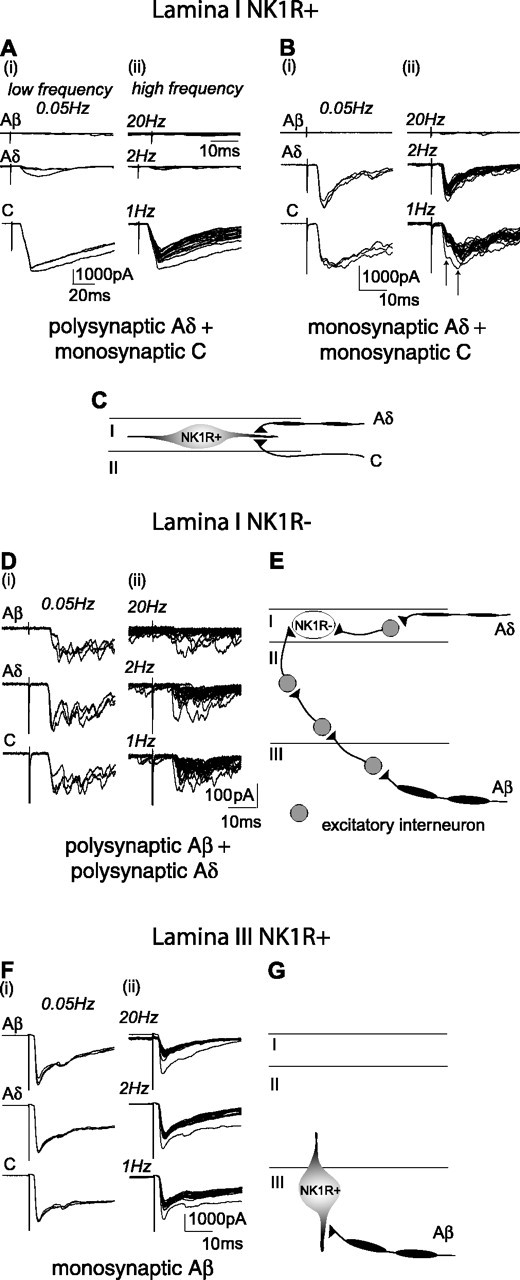
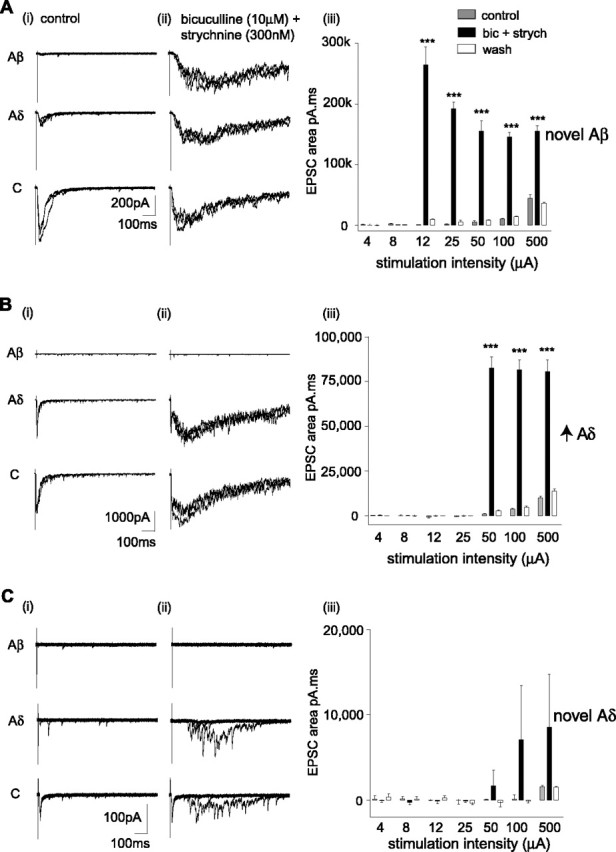
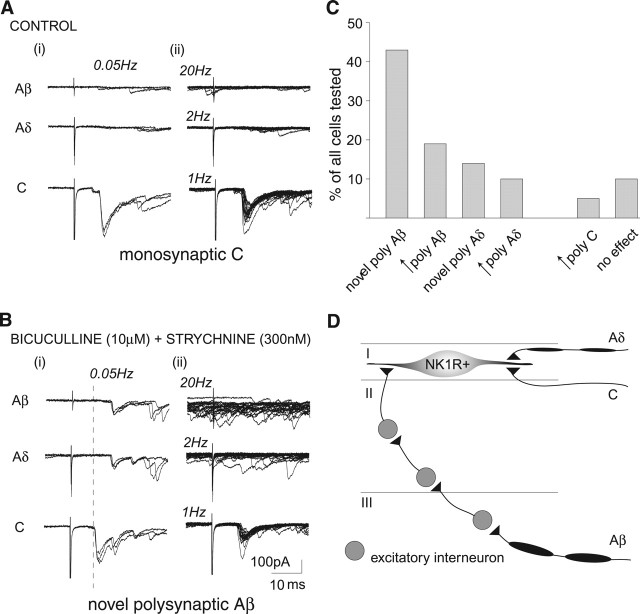
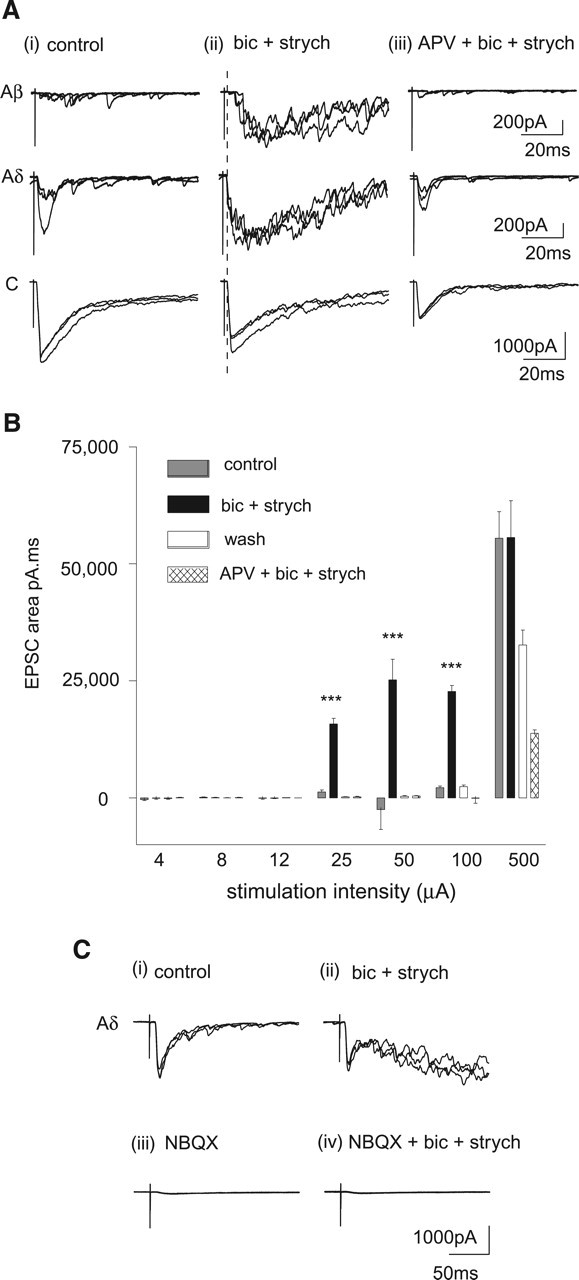
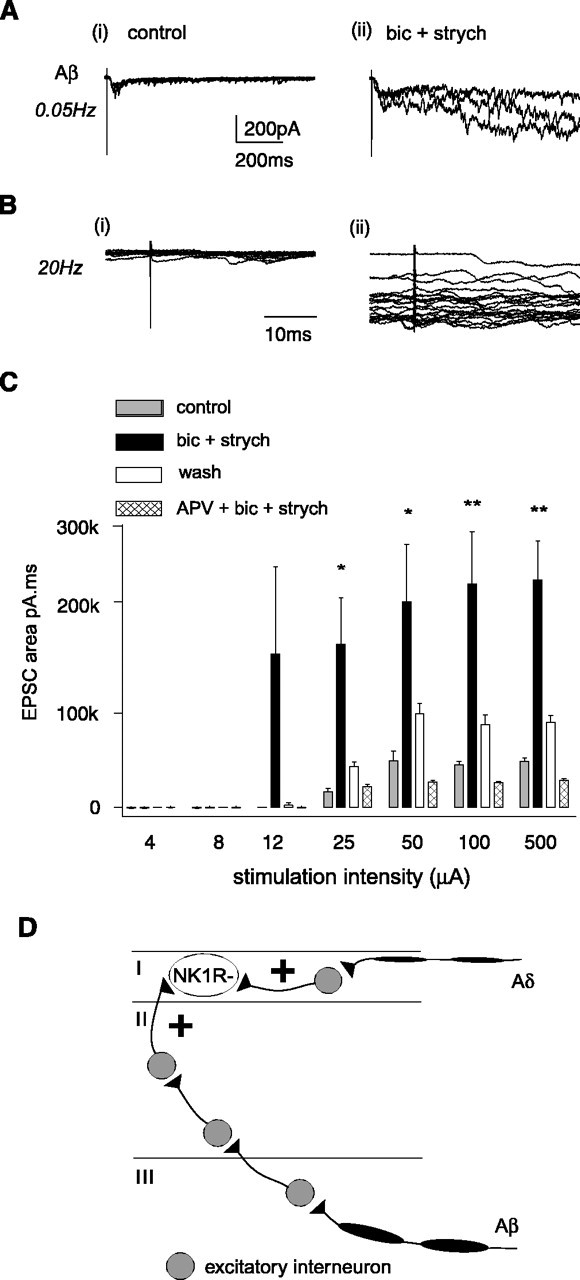
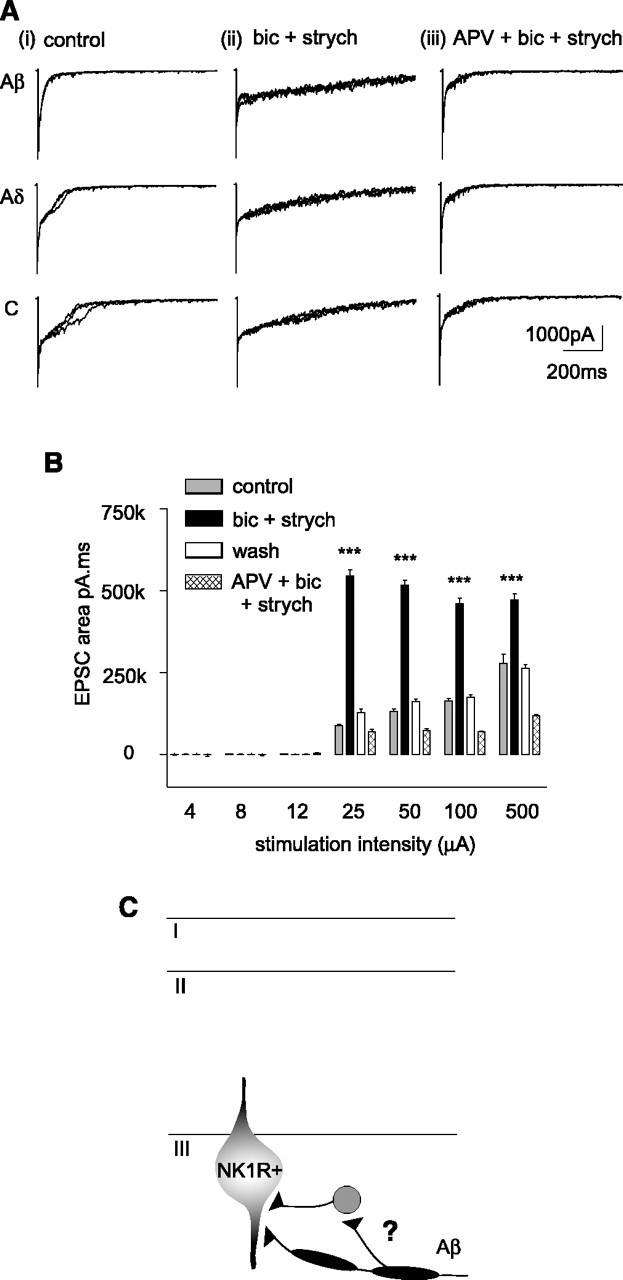
Blockade of local spinal cord inhibition mimics the behavioral hypersensitivity that manifests in chronic pain states. This suggests that there is a pathway capable of mediating allodynia/hyperalgesia that exists but is normally under strong inhibitory control. Lamina I and III neurokinin 1 (NK1) receptor expressing (NK1R+) dorsal horn neurons, many of which are projection neurons, are required for the development of this hypersensitivity and are therefore likely to be a component of this proposed pathway. To investigate, whole-cell patch-clamp recordings were made from lamina I and III NK1R+ neurons in the spinal cord slice preparation with attached dorsal root. Excitatory postsynaptic currents were recorded in response to electrical stimulation of the dorsal root. Lamina I NK1R+ neurons were shown to receive high-threshold (Adelta/C fiber) monosynaptic input, whereas lamina III NK1R+ neurons received low-threshold (Abeta fiber) monosynaptic input. In contrast, lamina I neurons lacking NK1 receptor (NK1R-) received polysynaptic A fiber input. Blockade of local GABAergic and glycinergic inhibition with bicuculline (10 microm) and strychnine (300 nm), respectively, revealed significant A fiber input to lamina I NK1R+ neurons that was predominantly Abeta fiber mediated. This novel A fiber input was polysynaptic in nature and required NMDA receptor activity to be functional. In lamina I NK1R- and lamina III NK1R+ neurons, disinhibition enhanced control-evoked responses, and this was also NMDA receptor dependent. These disinhibition-induced changes, in particular the novel polysynaptic low-threshold input onto lamina I NK1R+ neurons, may be an underlying component of the hypersensitivity present in chronic pain states.


Figures

Figure 1.
Figure 1.
TMR-SP labeling of a lamina I neuron (A) and a lamina III neuron (B). i–iii, IR-DIC image of a neuron (i) visualized with TMR-SP fluorescence (ii) and filled with Alexa Fluor 488 hydrazide (iii). A recording pipette can be seen in i and iii. iv, The location of the recording pipette is shown at low magnification and is outlined for clarity. In A, the tip of the recording pipette is located in lamina I and is clearly dorsal to the relatively translucent band corresponding to the substantia gelatinosa. In B, the tip of the recording pipette is located just ventral to the substantia gelatinosa in lamina III. Scale bar: i–iii, 20 μm; iv, 200 μm.
Figure 2.
Figure 2.
Differential primary afferent synaptic input to lamina I NK1R+, lamina I NK1R−, and lamina III NK1R+ neurons. A and B show characterization of primary afferent synaptic input to two lamina I NK1R+ neurons receiving monosynaptic C and monosynaptic Aδ and C fiber input, respectively. In this and subsequent panels, i shows examples of EPSCs evoked by stimulation (0.1 ms) using Aβ (25 μA), Aδ (100 μA), and C fiber (500 μA) stimulation intensities at low frequency. Each trace comprises three superimposed traces evoked at 0.05 Hz. ii shows examples of EPSCs evoked by higher-frequency stimulation (25 μA/20 Hz; 100 μA/2 Hz; 500 μA/1 Hz). Each trace comprises 20 superimposed traces. In B, the two arrows denote the monosynaptic Aδ and monosynaptic C components. C, Schematic illustrating that lamina I NK1R+ neurons predominantly receive high-threshold (C or Aδ fiber) primary afferent monosynaptic input. D, Characterization of primary afferent synaptic input to an individual lamina I NK1R− neuron receiving polysynaptic Aβ and Aδ fiber input. E, Schematic illustrating that lamina I NK1R− neurons mainly receive polysynaptic A fiber primary afferent input. F, Characterization of primary afferent synaptic input to an individual lamina III NK1R+ neuron receiving monosynaptic Aβ fiber input. G, Schematic illustrating that lamina III NK1R+ neurons predominantly receive low-threshold Aβ fiber primary afferent monosynaptic input.
Figure 3.
Figure 3.
Disinhibition elicits novel and enhanced responses to A fiber stimulation in lamina I NK1R+ neurons. A–C, Data obtained from individual lamina I NK1R+ neurons with monosynaptic C fiber (A, C) and monosynaptic Aδ fiber (B) input. Disinhibition reveals Aβ (A) and Aδ (B, C) fiber input. i shows examples of EPSCs evoked by stimulation (0.1 ms) using Aβ (25 μA), Aδ (100 μA), and C fiber (500 μA) stimulation intensities at low frequency under control conditions. Each trace comprises three superimposed traces evoked at 0.05 Hz. ii shows EPSCs evoked by the same stimulation protocol as in i but in the presence of bicuculline (10 μm) and strychnine (300 nm). iii displays the synaptic response-stimulus intensity profile generated by calculating the EPSC area from the stimulus artifact to the end of the trace (900 ms) for each of the three EPSCs, at each intensity tested, and for all conditions. All averaged data are represented as mean ± SE. Repeated-measures ANOVA followed by Newman–Keuls posttests were used to determine whether “bicuculline + strychnine” is significantly different from all other conditions (***p < 0.001).
Figure 4.
Figure 4.
Novel A fiber input to lamina I NK1R+ neurons revealed by disinhibition is polysynaptic. A and B show data obtained from a neuron with monosynaptic C fiber input that received novel polysynaptic Aβ fiber input when inhibition was blocked. Examples of EPSCs evoked by low- and high-frequency stimulation in control (A) and in the presence of bicuculline (10 μm) and strychnine (300 nm) (B). i, Stimulation (0.1 ms) using Aβ (25 μA), Aδ (100 μA), and C fiber (500 μA) stimulation intensities at low frequency. Each trace comprises three superimposed traces evoked at 0.05 Hz. ii, Examples of EPSCs evoked by higher-frequency stimulation (25 μA/20 Hz; 100 μA/2 Hz; 500 μA/1 Hz). Each trace comprises 20 superimposed traces. The dotted line in B illustrates that the synaptic events revealed at 25 μA have a longer latency than the control monosynaptic input. C, Summary of the percentage of total lamina I NK1R+ neurons (n = 21) receiving novel or enhanced polysynaptic (poly) input, for each fiber type, under conditions of disinhibition. D, Schematic illustrating the main effect of disinhibition in lamina I NK1R+ neurons, which is the appearance of novel polysynaptic Aβ fiber input.
Figure 5.
Figure 5.
Disinhibition revealed polysynaptic A fiber input to lamina I NK1R+ neurons is NMDA receptor dependent. A and B display data from a neuron with C fiber monosynaptic input, which demonstrates polysynaptic Aβ fiber input revealed during disinhibition that is blocked by d-APV. Ai, Examples of EPSCs evoked by stimulation (0.1 ms) using Aβ (25 μA), Aδ (100 μA), and C fiber (500 μA) stimulation intensities at low frequency under control conditions. Each trace comprises three superimposed traces evoked at 0.05 Hz. ii shows EPSCs evoked by the same stimulation protocol but in the presence of bicuculline (10 μm) and strychnine (300 nm), and again in iii in the presence of bicuculline (10 μm), strychnine (300 nm), and d-APV (30 μm). Note that the synaptic events revealed at Aβ intensity have a longer latency than the control monosynaptic input (dotted line). B, The synaptic response-stimulus intensity profile generated by calculating the EPSC area from the stimulus artifact to the end of the recording (900 ms) for each of the three EPSCs at each intensity tested and for all conditions. C, Data from a neuron with control monosynaptic Aδ fiber input and disinhibition revealed polysynaptic Aδ fiber input, both of which are abolished, in the presence of NBQX. EPSCs evoked by low-frequency stimulation (0.1 ms, 0.05 Hz) using Aδ fiber stimulation intensity (100 μA) under control conditions (i), in 10 μm bicuculline and 300 nm strychnine (ii), in 10 μm NBQX (iii), in 10 μm bicuculline, 300 nm strychnine, and 10 μm NBQX (iv). Each trace comprises three superimposed traces evoked at 0.05 Hz.
Figure 6.
Figure 6.
Disinhibition increases polysynaptic A fiber input to lamina I NK1R− neurons in an NMDA receptor-dependent manner. Data are from a neuron with polysynaptic Aβ and Aδ fiber input, which shows increased polysynaptic A fiber input during disinhibition that is blocked by d-APV. Ai shows examples of EPSCs evoked by stimulation (0.1 ms) using Aβ (25 μA) stimulation intensities at low frequency under control conditions. Each trace comprises three superimposed traces evoked at 0.05 Hz. ii shows EPSCs evoked by the same stimulation protocol as in i but in the presence of bicuculline (10 μm) and strychnine (300 nm). B, EPSCs evoked by higher-frequency stimulation (20 Hz) at Aβ (25 μA) stimulation intensities in control (i) and disinhibition (ii) conditions at a faster timescale. Each trace comprises 20 superimposed traces. C, The synaptic response-stimulus intensity profile generated by calculating the EPSC area from the stimulus artifact to the end of the trace (900 ms) for each of the three EPSCs, at each intensity tested, and for all conditions. D, Schematic illustrating that disinhibition enhances polysynaptic A fiber input to lamina I NK1R− neurons.
Figure 7.
Figure 7.
Disinhibition enhances responses to A fiber input in lamina III NK1R+ neurons and is blocked by an NMDA receptor antagonist. These data are from the neuron shown to receive monosynaptic Aβ fiber input in Figure 2F and are shown at a slower timescale. Ai shows examples of EPSCs evoked by stimulation (0.1 ms) using Aβ (25 μA), Aδ (100 μA), and C fiber (500 μA) stimulation intensities at low frequency under control conditions. Each trace comprises three superimposed traces evoked at 0.05 Hz. ii shows EPSCs evoked by the same stimulation protocol as in i but in the presence of bicuculline (10 μm) and strychnine (300 nm), and, in iii, in the presence of bicuculline (10 μm), strychnine (300 nm), and d-APV (30 μm). B, The synaptic response-stimulus intensity profile generated by calculating the EPSC area from the stimulus artifact to the end of the trace (900 ms) for each of the three EPSCs, at each intensity tested, and for all conditions. C, Schematic illustrating that polysynaptic A fiber input may underlie the disinhibition enhanced evoked responses in lamina III NK1R+ neurons.

Similar articles

Cited by

References

    1. Abbadie C, Trafton J, Liu H, Mantyh PW, Basbaum AI (1997). Inflammation increases the distribution of dorsal horn neurons that internalize the neurokinin-1 receptor in response to noxious and non-noxious stimulation. J Neurosci 17:8049–8060. - PMC - PubMed
    1. Baba H, Ji RR, Kohno T, Moore KA, Ataka T, Wakai A, Okamoto M, Woolf CJ (2003). Removal of GABAergic inhibition facilitates polysynaptic A fiber-mediated excitatory transmission to the superficial spinal dorsal horn. Mol Cell Neurosci 24:818–830. - PubMed
    1. Bardoni R, Magherini PC, MacDermott AB (2000). Activation of NMDA receptors drives action potentials in superficial dorsal horn from neonatal rats. NeuroReport 11:1721–1727. - PubMed
    1. Bennett VJ, Simmons MA (2001). Analysis of fluorescently labeled substance P analogs: binding, imaging and receptor activation. BMC Chem Biol 1:1. - PMC - PubMed
    1. Bernard JF, Bester H, Besson JM (1996). Involvement of the spino-parabrachio-amygdaloid and -hypothalamic pathways in the autonomic and affective emotional aspects of pain. Prog Brain Res 107:243–255. - PubMed

Publication types

Substances