. 2006 Feb 8;26(6):1854-63.
doi: 10.1523/JNEUROSCI.4812-05.2006.

Site of action potential initiation in layer 5 pyramidal neurons

Affiliations

Site of action potential initiation in layer 5 pyramidal neurons

Lucy M Palmer et al. J Neurosci. .

Abstract

Fundamental to an understanding of how neurons integrate synaptic input is the knowledge of where within a neuron this information is converted into an output signal, the action potential. Although it has been known for some time that action potential initiation occurs within the axon of neurons, the precise location has remained elusive. Here, we provide direct evidence using voltage-sensitive dyes that the site of action potential initiation in cortical layer 5 pyramidal neurons is approximately 35 microm from the axon hillock. This was the case during action potential generation under a variety of conditions, after axonal inhibition, and at different stages of development. Once initiated action potentials propagated down the axon in a saltatory manner. Experiments using local application of low-sodium solution and TTX, as well as an investigation of the influence of axonal length on action potential properties, provided evidence that the initial 40 microm of the axon is essential for action potential generation. To morphologically identify the relationship between the site of action potential initiation and axonal myelination, we labeled oligodendrocytes supplying processes to the proximal region of the axon. These experiments indicated that the axon initial segment was approximately 40 mcirom in length, and the first node of Ranvier was approximately 90 microm from the axon hillock. Experiments targeting the first node of Ranvier suggested it was not involved in action potential initiation. In conclusion, these results indicate that, in layer 5 pyramidal neurons, action potentials are generated in the distal region of the axon initial segment.


Figures

Figure 1.
Figure 1.
Precision of onset latency measurement. A, Examples of AP light responses with different onset latencies generated by driving a light-emitting diode with an AP voltage command within its linear range and detected with either a photodiode (PD) sampling at 100 kHz (top) or our camera-based system sampling at 10 kHz (middle). Bottom, Plot of onset latency of AP light responses detected with the PD versus the camera system. B, Image of a layer 5 pyramidal neuron filled with voltage-sensitive dye (resolution, 80 × 12; depixelated). ROIs at the soma, apical dendrite, and axon are indicated. C, Example of an AP evoked by extracellular stimulation and recorded at the soma via the whole-cell recording pipette (top; timing of extracellular stimulus indicated by stimulus artifact) together with the associated VSD signals at the soma for a single sweep (middle) and an average of 60 trails aligned individually to the soma AP (bottom). The scaled voltage recorded at the soma is shown in orange. The somatic ROI is indicated in B. D, Average AP evoked VSD signals (100 trials) in the axon, soma, and apical dendrite for the ROIs indicated in B. The linear regression fitted to the rising phase of the different VSD signals used to determine onset latency at 50% of peak is superimposed (black).
Figure 2.
Figure 2.
Imaging AP initiation with VSDs. A, Left, High-magnification image of the axon of a layer 5 pyramidal neuron filled with VSD. Right, Average fluorescence change (ΔF/F) of 130 individually aligned APs recorded at the indicated axonal locations. APs were evoked by somatic current injection. B, Onset latency of axonal VSD signals relative to the somatic response (0 μm) plotted against distance from the axon hillock for the data in A. The site of AP initiation is indicated by a black arrow. Gray arrows indicate location of axonal branch points. C, Average onset latency of axonal VSD signals relative to the somatic response plotted against distance from the axon hillock for orthodromic (filled circles; n = 34) and antidromic APs (open circles; n = 6). Data for orthodromic APs were pooled from experiments in which APs were evoked by brief somatic current injection (n = 27) and synaptic stimulation (n = 7).
Figure 3.
Figure 3.
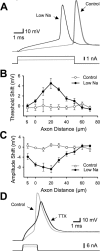
Impact of local reductions in sodium current on AP properties. A, Example of APs evoked by somatic current injection during brief (20 ms) low-sodium application to the axon initial segment (20 μm from the axon hillock) compared with control APs recorded before and after low-sodium application. Low-sodium extracellular solution led to a significant increase in both AP threshold and the amplitude of the somatic current step (bottom) required to reach threshold. B, Average shift in somatic AP threshold and amplitude (C), relative to control during brief application of low-sodium solution (filled circles) or normal extracellular solution (open circles) to the axon at different locations. S, Soma. The axon hillock is 0 μm. D, APs evoked by somatic current injection during brief (5–10 ms) focal application of TTX (10 μm) to the axon initial segment (20 μm from the axon hillock) compared with a control AP recorded before TTX application.
Figure 4.
Figure 4.
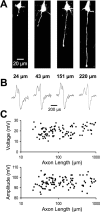
Impact of axonal length on AP properties. A, Confocal images of layer 5 pyramidal neurons (Alexa 568) with axons of the indicated lengths. Note the characteristic bulbous end of the severed axon. B, Double differentiation of the somatic AP voltage in the neurons illustrated in A. All neurons exhibited two distinct components, presumably resulting from the separate charging of the initial segment and the soma. C, The voltage change required to reach AP threshold (top) and AP amplitude (bottom) measured from threshold in neurons with different axon lengths (21–968 μm; n = 108). APs evoked by somatic current injection.
Figure 5.
Figure 5.
Morphological identification of the axon initial segment. A, Two examples of confocal microscope images of oligodendrocytes and associated processes (red; Alexa Fluor 568) myelinating the initial region of the axon of a layer 5 pyramidal neuron (yellow; Oregon Green 488). In both examples, the oligodendrocyte cell body can be identified as a red sphere (arrow). B, Pooled data (n = 6) of the average distance from the axon hillock to the start of the first myelin process (∼40 μm), the length of the first myelin process (∼50 μm), and the distance from the axon hillock to the end of the first myelin process (∼90 μm), indicating the distance to the first node of Ranvier. Error bars represent SEM.
Figure 6.
Figure 6.
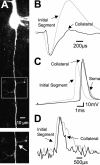
Role of the first node of Ranvier in AP initiation. A, Top, Confocal image of a layer 5 pyramidal neuron axon (Alexa Fluor 568) with two collateral processes. Bottom, Magnification of the boxed region showing the first branch point (arrow). The first collateral process was 100 μm from the axon hillock and presumably represents the first node of Ranvier. B, Normalized extracellular voltage responses during APs evoked by somatic current injection and recorded at the initial segment 40 μm from the axon hillock (gray; average of 110 trails) and at the first axon branch point (black; 127 μm from the axon hillock; average of 110 trails). The onset of the extracellular voltage response recorded at the initial segment precedes that recorded at the first branch point, suggesting AP initiation does not occur at the first node of Ranvier. C, APs evoked by somatic current injection during application of low-sodium solution to the initial segment, soma, and first axon collateral. Focal application of low-sodium extracellular solution only significantly influenced AP threshold when applied to the axon initial segment. D, Average fluorescence change (ΔF/F) of 140 individually aligned somatically evoked APs recorded at the initial segment (35 μm from the hillock) and at the first collateral branch point (95 μm from the hillock). The fluorescence change at the initial segment occurs before the fluorescence change recorded at the first collateral, illustrating that the AP occurs at the initial segment before it proceeds to the first node of Ranvier.
Figure 7.
Figure 7.
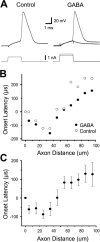
The effect of inhibition on AP initiation. A, Left, AP evoked by somatic current injection during control (no GABA). Right, Focal application of GABA (100 μm) to the initial segment inhibited AP generation, which could be re-established by increasing the amplitude of the somatic current pulse. B, Onset latency of axonal VSD signals relative to the somatic response (0 μm) plotted against distance from the axon hillock during GABA application to the initial segment (filled circles) and control (open circles). C, Average onset latency of axonal VSD signals relative to that at the soma plotted against distance from the axon hillock during GABA application to the initial segment (n = 9).
Figure 8.
Figure 8.
Development of AP initiation and propagation. A, Left, Fluorescent image of a mature (P21–P28) layer 5 pyramidal neuron filled with VSD. Right, Average fluorescence signal (ΔF/F) measured at the indicated locations along the axon (average, 100 trials). The fluorescence signal at the first branch point, ∼115 μm from the hillock, occurs before the fluorescence signal recorded in the preceding axon region (75 μm from the hillock). B, Left, Fluorescent image of an immature (P5) layer 5 pyramidal neuron filled with VSD. Right, Average fluorescence signal (ΔF/F) measured at the indicated locations along the axon (average, 140 trials). Note the sequential propagation of the fluorescence signal along the axon. C, Onset latency of axonal VSD signals relative to the somatic response (0 μm) plotted against distance from the axon hillock for the immature (P5) and mature (P21–P28) layer 5 pyramidal neurons shown in A and B. APs were evoked by brief somatic current injection.

Similar articles

Cited by

References

    1. Antic SD (2003). Action potentials in basal and oblique dendrites of rat neocortical pyramidal neurons. J Physiol (Lond) 550:35–50. - PMC - PubMed
    1. Bishop PO, Levick WR (1956). Saltatory conduction in single isolated and non-isolated myelinated nerve fibres. J Cell Physiol 48:1–34. - PubMed
    1. Boiko T, Rasband MN, Levinson SR, Caldwell JH, Mandel G, Trimmer JS, Matthews G (2001). Compact myelin dictates the differential targeting of two sodium channel isoforms in the same axon. Neuron 30:91–104. - PubMed
    1. Boiko T, Van Wart A, Caldwell JH, Levinson SR, Trimmer JS, Matthews G (2003). Functional specialization of the axon initial segment by isoform-specific sodium channel targeting. J Neurosci 23:2306–2313. - PMC - PubMed
    1. Buhl EH, Han ZS, Lorinczi Z, Stezhka VV, Karnup SV, Somogyi P (1994). Physiological properties of anatomically identified axo-axonic cells in the rat hippocampus. J Neurophysiol 71:1289–1307. - PubMed

Publication types

LinkOut - more resources