. 2006 Feb 21;103(8):2701-6.
doi: 10.1073/pnas.0511138103. Epub 2006 Feb 9.

Homotypic fusion of early endosomes: SNAREs do not determine fusion specificity

Affiliations

Homotypic fusion of early endosomes: SNAREs do not determine fusion specificity

Dorothea Brandhorst et al. Proc Natl Acad Sci U S A. .

Abstract

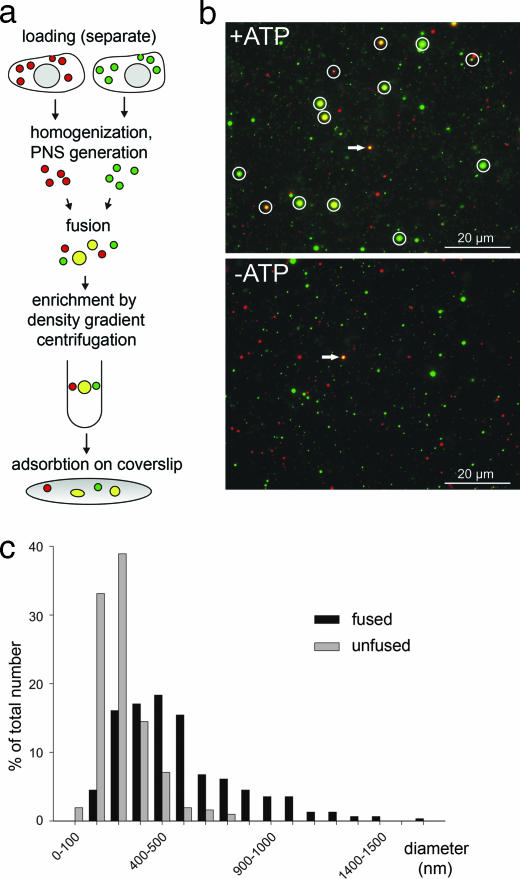
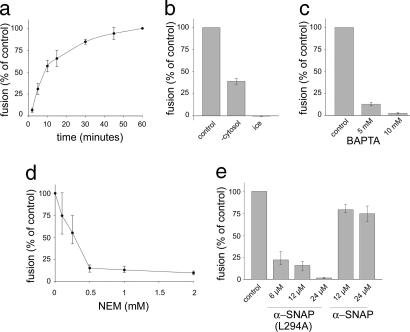
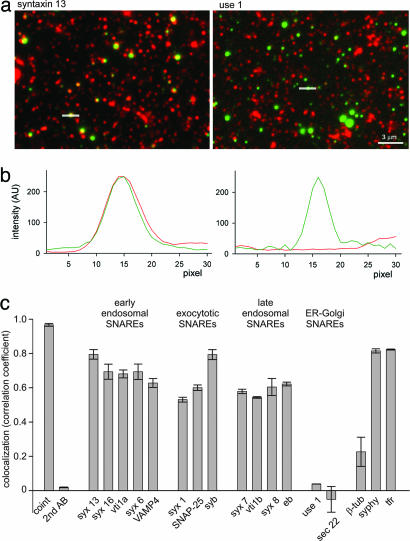
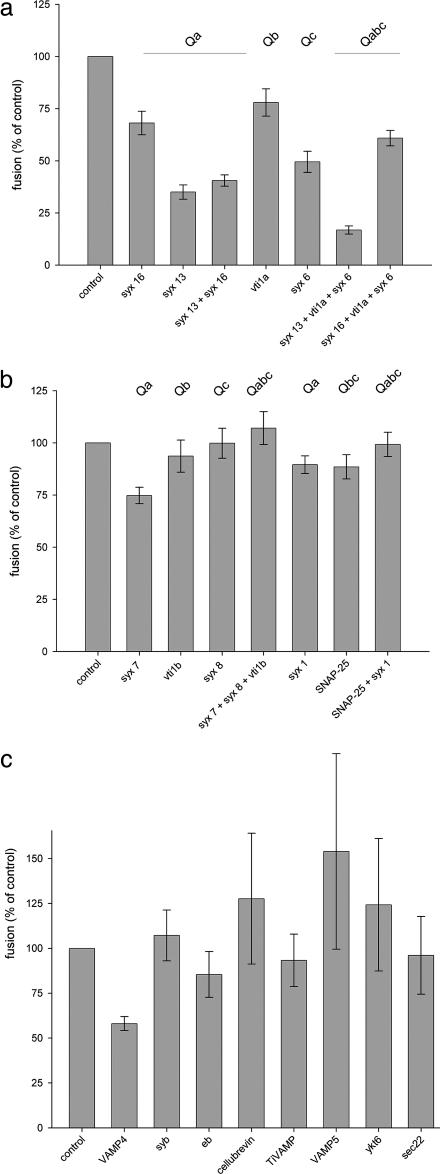
Membrane fusion in the secretory pathway is mediated by soluble N-ethylmaleimide-sensitive factor attachment receptor (SNARE) proteins. Different fusion steps are thought to be effected by independent sets of SNAREs, but it is unclear whether specificity is determined by an intrinsic specificity of SNARE pairing or by upstream factors. Using a newly developed microscopy-based assay, we have investigated the SNARE specificity of homotypic early endosomal fusion. We show that early endosomes contain multiple sets of SNAREs, including, in addition to the putative early endosomal SNAREs, those involved in exocytosis and in fusion of late endosomes. We demonstrate that fusion is largely mediated by a complex formed by syntaxin 13, syntaxin 6, vti1a, and VAMP4, whereas the exocytic and late endosomal SNAREs play little or no role in the reaction. In contrast, proteoliposomes reconstituted with early endosomal SNAREs promiscuously fuse with liposomes containing exocytotic or late endosomal SNAREs. We conclude that the specificity of SNARE pairing does not suffice to determine the specificity of organelle fusion.


Conflict of interest statement

Conflict of interest statement: No conflicts declared.

Figures

Fig. 1.
Fig. 1.
Microscopic assay for measuring fusion of early endosomes from PC12 cells. (a) Schematic overview of the assay. (b) Representative micrographs of fusion reactions (45 min of incubation) after adsorption of endosomes on coverslips (green channel, dextran-Alexa 488; red channel, dextran-Alexa 594). Fusion assays were carried out in the presence of either an ATP-regenerating system (+ATP) or an ATP-depleting system (−ATP). Images acquired in the red and green channels were aligned by using fluorescent beads (arrows) as reference. Fused endosomes are identified by colocalization (yellow, circles). (c) Size distribution of labeled organelles after incubation for 45 min. Sizes of fused (black) and unfused (gray) organelles were measured by linescan analysis (corrected for the point spread function, see Materials and Methods for details), binned in 100-nm classes, and plotted as percentage of total number (n = 311 for each population).
Fig. 2.
Fig. 2.
Characterization of early endosome fusion by using the microscopic assay. (a) Time course of endosome fusion. Values are means ± SEM of eight independent experiments. Fusion is given as percentage of the 60-min value. (b) Endosome fusion is accelerated when supplemented with rat brain cytosol and is blocked at 0°C. Values are means ± SEM of eight (cytosol) or seven (ice) independent experiments. (c) Endosome fusion is Ca2+-dependent. Fusion assays were performed in the presence of 5 mM or 10 mM 1,2-bis(2-aminophenoxy)ethane-N,N,N,N′-tetraacetate (BAPTA) as Ca2+-chelator. Values are means ± SEM of 14 independent experiments. (d) NEM inhibits fusion activity. Both PNSs and rat brain cytosol were preincubated separately with indicated concentrations of NEM for 15 min on ice. Values are means of four independent experiments. Error bars indicate the range of values. (e) Inhibition of endosome fusion by the dominant negative α-SNAP mutant L294A. PNS fractions were preincubated separately with the indicated concentrations of α-SNAP (L294A) or of wild-type α-SNAP for 15 min on ice. Values are means of two to four independent experiments. Error bars indicate the range of values.
Fig. 3.
Fig. 3.
Localization of SNAREs on early endosomes by using immunocytochemistry. (a) Fluorescence micrographs showing endosomes labeled with dextran-Alexa 488 (green channel) immunostained for syntaxin 13 (Left) and use 1 (Right) (red channel). To determine colocalization, linescans were performed through the intensity centers of green endosomes (examples indicated by white lines). (b) Representative linescan analysis, obtained from the images shown in a, showing intensity profiles of green (endosomes) and red (antibody-staining) signals. (c) Colocalization between early endosomes and SNARE proteins as determined by linescan analysis and correlation (see Materials and Methods). A correlation coefficient of 1 represents complete colocalization, whereas a correlation coefficient of ≈0 represent independent distribution. Coint, simultaneous labeling with dextran-Alexa 488 and dextran-Alexa 594 (positive control); 2nd AB, omission of the primary antibody (negative control); syphy, synaptophysin; syx, syntaxin; eb, endobrevin/VAMP8; β-tub, β-tubulin; tfr, transferrin receptor. Values are means of two independent experiments with 60 analyzed endosomes each. Error bars indicate the range of values.
Fig. 4.
Fig. 4.
Effects of adding recombinant SNAREs on fusion of early endosomes. (a) Effects of Q-SNAREs considered to be involved in the fusion of early endosomes, including syntaxin 16 (syx 16), syntaxin 13 (syx 13), vti1a, and syntaxin 6 (syx 6). Values are means ± SEM of 7–10 independent experiments. (b) Effects of late endosomal and neuronal Q-SNAREs, including syntaxin 7 (syx 7), vti1b, syntaxin 8 (syx 8), syntaxin 1 (syx 1), and SNAP-25. Values are means ± SEM of 7–13 independent experiments. (c) Effects of R-SNAREs, including VAMP4, synaptobrevin/VAMP2 (syb), endobrevin/VAMP8 (eb), cellubrevin/VAMP3, Ti-VAMP/VAMP7, VAMP5, ykt6, and sec22. Values are means ± SEM of three to seven independent experiments. Individual Q-SNAREs were used at 12 μM, with R-SNAREs tested at 25 μM.
Fig. 5.
Fig. 5.
Proteoliposomes containing the Q-SNAREs syntaxin 13, syntaxin 6, and vti1a show no specificity for R-SNAREs in fusion. (a) Fusion with liposomes containing VAMP4, endobrevin, or synaptobrevin. Fusion was monitored by fluorescence dequenching due to dilution of labeled phospholipids with unlabeled phospholipids during fusion (see Materials and Methods) and normalized to maximal fluorescence measured after adding detergent at the end of the reaction. As control, Q-SNARE liposomes were preincubated for 1 h at room temperature with purified endobrevin or synaptobrevin lacking the transmembrane domain (soluble fragment, final concentration of 30 μM) before starting the fusion reaction. (bd) Dose-dependent inhibition by soluble R-SNAREs of fusion between liposomes containing the Q-SNAREs syntaxin13, vti1a, and syntaxin 6 and liposomes containing the R-SNARE VAMP4. Measurements were performed at 37°C with an overall protein concentration of 3 μM in the liposomes. The soluble R-SNAREs were added simultaneously with the acceptor liposomes at the start of the reaction (concentrations represent final assay concentrations).

References

    1. Fasshauer D. Biochim. Biophys. Acta. 2003;1641:87–97. - PubMed
    1. Rizo J., Südhof T. C. Nat. Rev. Neurosci. 2002;3:641–653. - PubMed
    1. Jahn R., Lang T., Südhof T. C. Cell. 2003;112:519–533. - PubMed
    1. Hanson P. I., Roth R., Morisaki H., Jahn R., Heuser J. E. Cell. 1997;90:523–535. - PubMed
    1. Sutton R. B., Fasshauer D., Jahn R., Brunger A. T. Nature. 1998;395:347–353. - PubMed

Publication types