Case Reports
. 2006 Mar 15;140(6):573-9.
doi: 10.1002/ajmg.a.31132.

A 9-year-old male with a duplication of chromosome 3p25.3p26.2: clinical report and gene expression analysis

Affiliations
Case Reports

A 9-year-old male with a duplication of chromosome 3p25.3p26.2: clinical report and gene expression analysis

Douglas C Bittel et al. Am J Med Genet A. .

Abstract

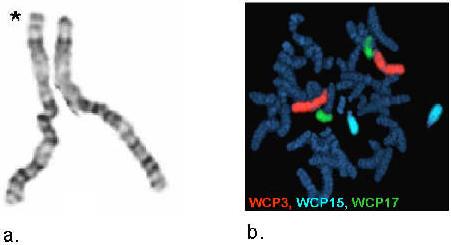
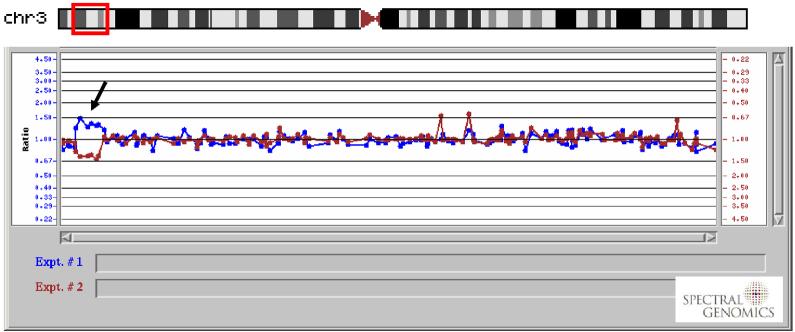
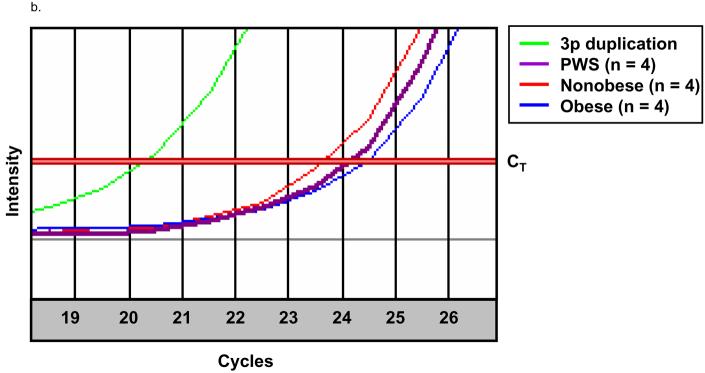
We describe a 9-year-old male referred for genetic evaluation for Prader-Willi syndrome (PWS). PWS is the most common genetically defined cause of life-threatening obesity and results from a functional loss of paternally expressed genes from the chromosome 15q11-q13 region. The patient presented with pervasive developmental disorder, delayed speech, and rapid onset of obesity at age 4 years, all features similar to PWS. However, chromosome 15q11-q13 methylation testing and fragile X studies were normal. GTG-banding and fluorescence in situ hybridization (FISH) with whole chromosome 3 paint probe (WCP3) and a chromosome 3p subtelomeric probe suggested a duplication of 3p25.3p26.2, a finding supported by comparative genomic hybridization (CGH). This region of chromosome 3p contains genes which contribute to obesity and behavioral problems, most notably, ghrelin (GHRL), an oxytocin receptor (OXTR), solute carrier family six members (gamma-aminobutyric acid (GABA) neurotransmitter transporters, SLC6A1 and SLC6A11), and peroxisome proliferator-activated receptor gamma (PPARG). To characterize these obesity and behavior related genes in our subject, we performed quantitative RT-PCR and compared expression levels with similarly aged male subjects (four non-obese males, four obese males, and four PWS males-two with 15q11-q13 deletions and two with maternal disomy 15). Our studies suggest increased expression of several genes in the 3p duplication region, including GHRL and PPARG, which may contribute to the phenotypic features in our 3p duplication subject.


Figures

Figure 1
Figure 1
Frontal and facial views of the 9-year-old male with a duplication of chromosome 3p25.3p26.2.
Figure 2
Figure 2
Figure 2a. GTG-banded chromosome 3s (* designates chromosome with 3p duplication). Figure 2b. Whole chromosome painting for chromosomes 3, 15 and 17.
Figure 3
Figure 3
Comparative genomic hybridization DNA microarray results of chromosome 3 from our 3p duplication subject. Arrow indicates region of duplication.
Figure 4
Figure 4
Representative quantitative RT-PCR using primers specific for a. GHRL and b. PPARG. Total RNA was extracted from actively growing lymphoblast cells and equal quantities were used in a QuantiTect all-in-one RT-PCR using SYBR green fluorescence to quantify the amplicon. The CT was set at the narrowest portion of the logarithmic phase of PCR cycle amplification at which the signal intensity exceeds the detection threshold. Fold change is calculated as 2|3p – Comp|, (3p = CT of the 3p duplication subject and Comp = CT of the comparison subject). a. Representative quantitative RT-PCR for the GHRL gene. The CTs were 23.2, 23.7, 24.4 and 24.9 for the 3p duplication, PWS, nonobese and obese subjects, respectively. The difference in CT value used to determine gene fold expression change between the 3p duplication subject and the PWS, nonobese and obese subjects represent 1.4, 2.3 and 3.3 fold less expression respectively relative to the 3p duplication subject. b. Representative quantitative RT-PCR for the PPARG gene. The CTs were 20.8, 25.4, 24.4 and 25.6 for the 3p duplication, PWS, nonobese and obese subjects, respectively. The difference in CT value used to determine gene fold expression change between the 3p duplication subject and the PWS, nonobese and obese subjects represent a 24.3, 12.1 and 27.9 fold less gene expression respectively relative to the 3p duplication subject.
Figure 4
Figure 4
Representative quantitative RT-PCR using primers specific for a. GHRL and b. PPARG. Total RNA was extracted from actively growing lymphoblast cells and equal quantities were used in a QuantiTect all-in-one RT-PCR using SYBR green fluorescence to quantify the amplicon. The CT was set at the narrowest portion of the logarithmic phase of PCR cycle amplification at which the signal intensity exceeds the detection threshold. Fold change is calculated as 2|3p – Comp|, (3p = CT of the 3p duplication subject and Comp = CT of the comparison subject). a. Representative quantitative RT-PCR for the GHRL gene. The CTs were 23.2, 23.7, 24.4 and 24.9 for the 3p duplication, PWS, nonobese and obese subjects, respectively. The difference in CT value used to determine gene fold expression change between the 3p duplication subject and the PWS, nonobese and obese subjects represent 1.4, 2.3 and 3.3 fold less expression respectively relative to the 3p duplication subject. b. Representative quantitative RT-PCR for the PPARG gene. The CTs were 20.8, 25.4, 24.4 and 25.6 for the 3p duplication, PWS, nonobese and obese subjects, respectively. The difference in CT value used to determine gene fold expression change between the 3p duplication subject and the PWS, nonobese and obese subjects represent a 24.3, 12.1 and 27.9 fold less gene expression respectively relative to the 3p duplication subject.

References

    1. Bittel DC, Kibiryeva N, Talebizadeh Z, Butler MG. Microarray analysis of gene/transcript expression in Prader-Willi syndrome: deletion versus UPD. J Med Genet. 2003;40:568–574. - PMC - PubMed
    1. Brannan CI, Bartolomei MS. Mechanisms of genomic imprinting. Curr Opin Genet Dev. 1999;9:164–170. - PubMed
    1. Butler MG, Bittel DC, Talebizadeh Z. Plasma peptide YY and ghrelin levels in infants and children with Prader-Willi syndrome. J Pediatr Endocrinol Metab. 2004;17:1177–1184. - PMC - PubMed
    1. Butler MG, Thompson T. Prader-Willi syndrome: Clinical and genetic findings. The Endocrinol. 2000;10:35–165. - PMC - PubMed
    1. Cassidy SB. Prader-Willi syndrome. J Med Genet. 1997;34(11):917–923. - PMC - PubMed

Publication types