

Ultrasonic contrast agent shell rupture detected by inertial cavitation and rebound signals
- PMID: 16471439
- PMCID: PMC2013305
- DOI: 10.1109/tuffc.2006.1588398
Ultrasonic contrast agent shell rupture detected by inertial cavitation and rebound signals
Abstract
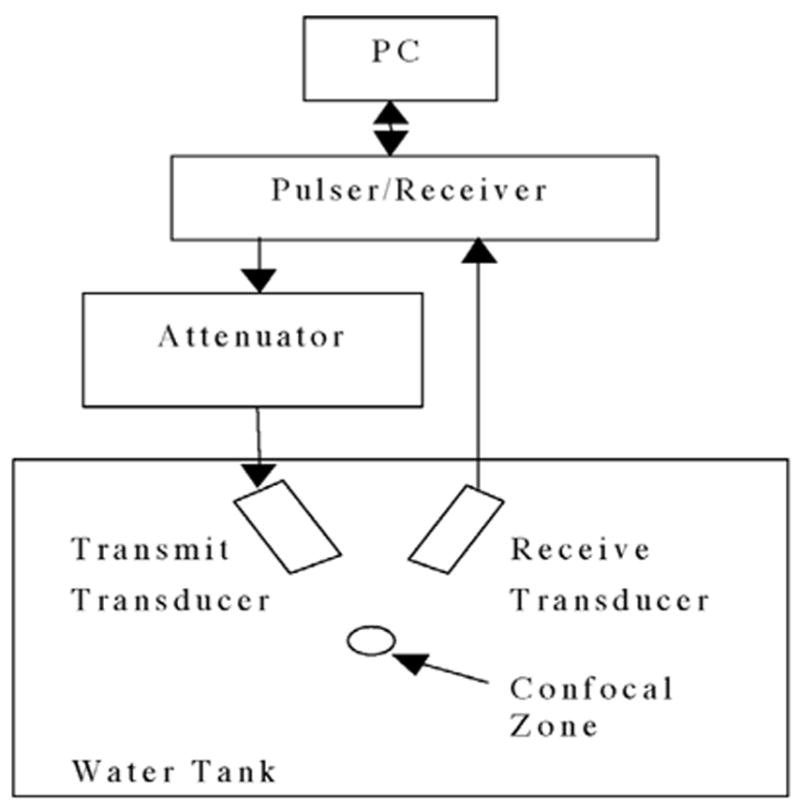
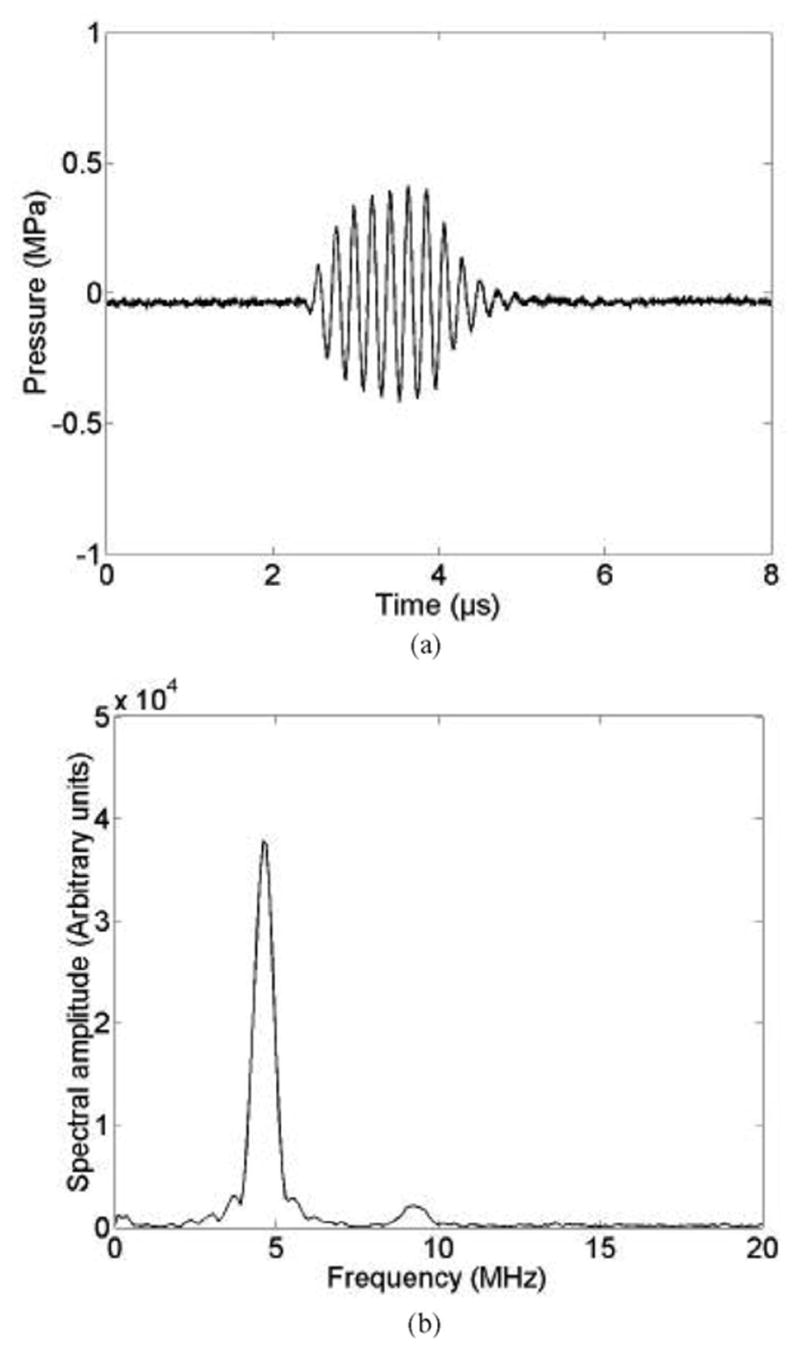
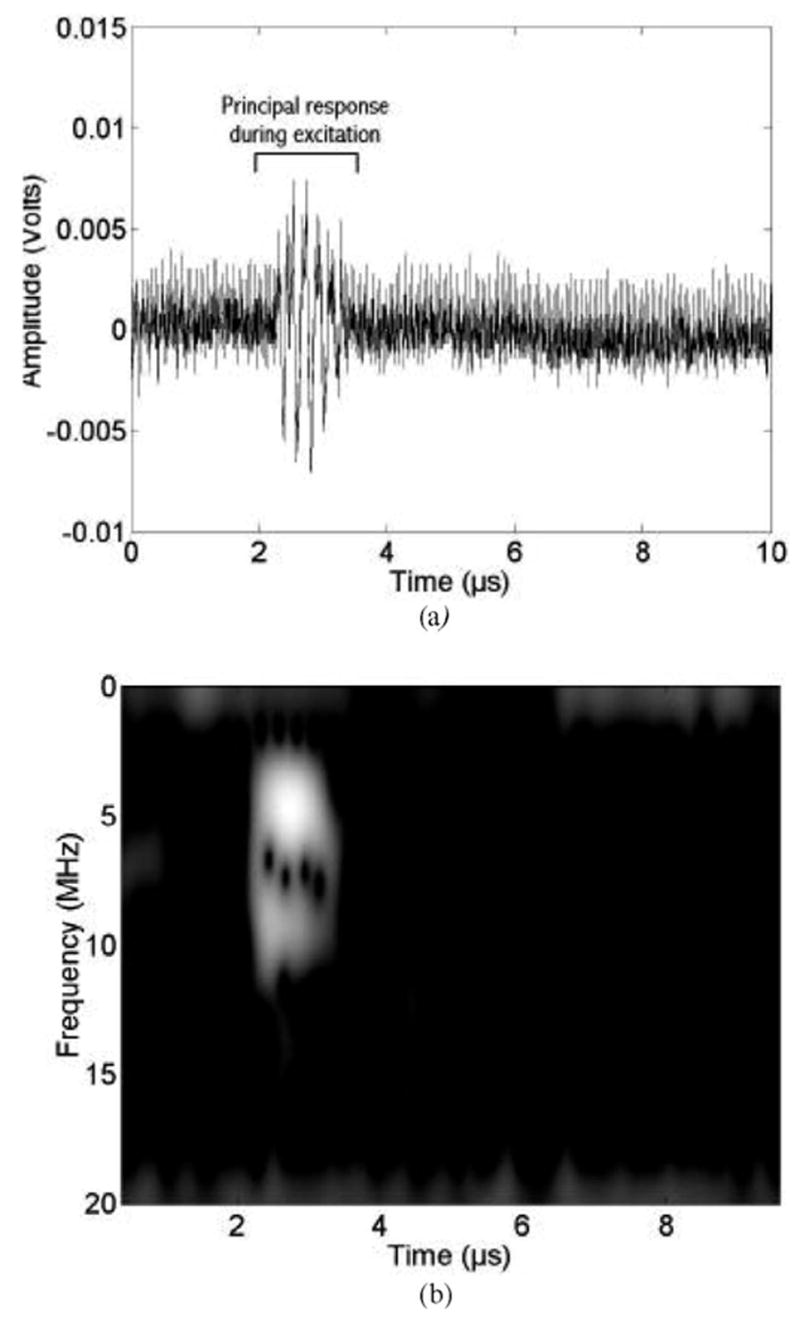
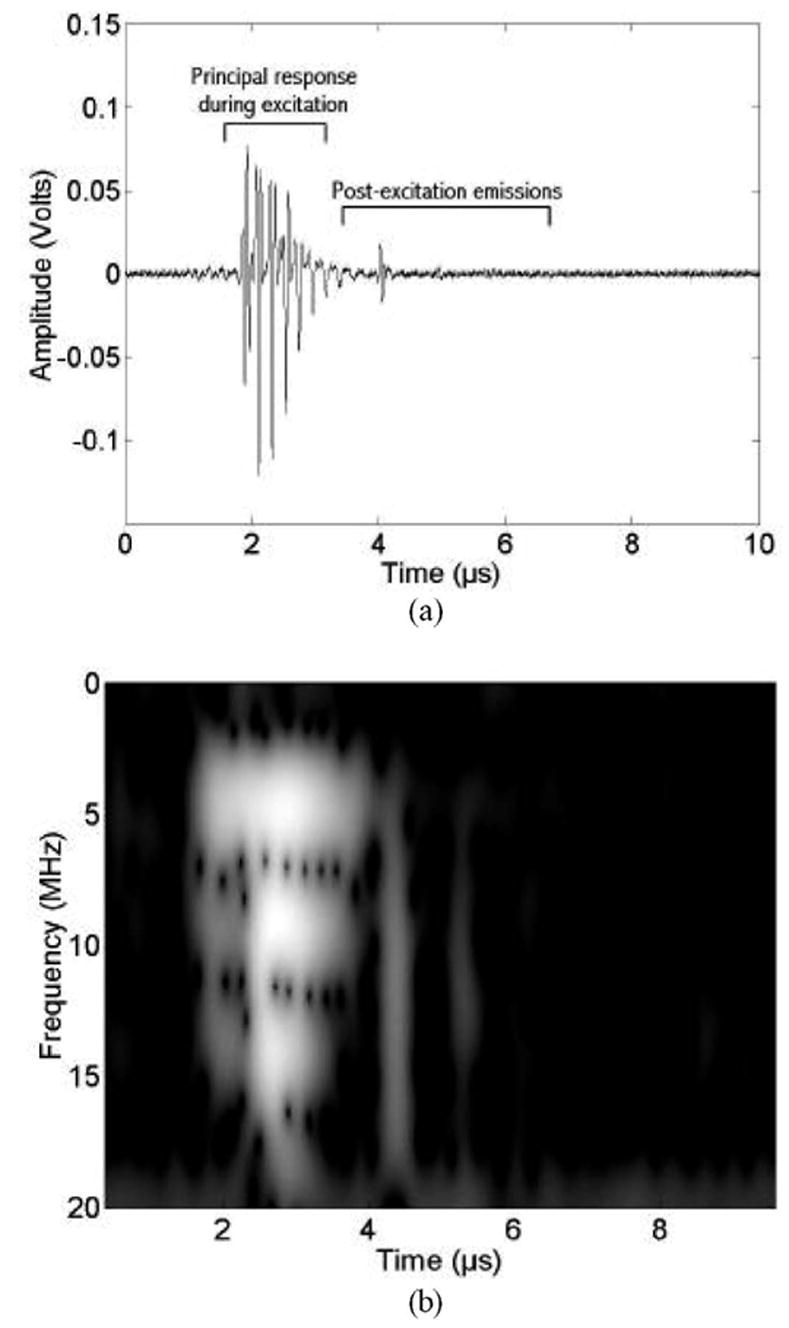
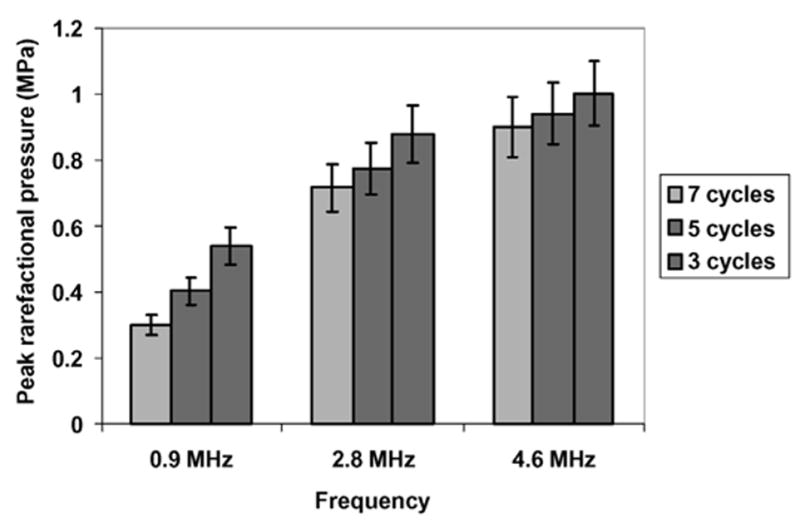
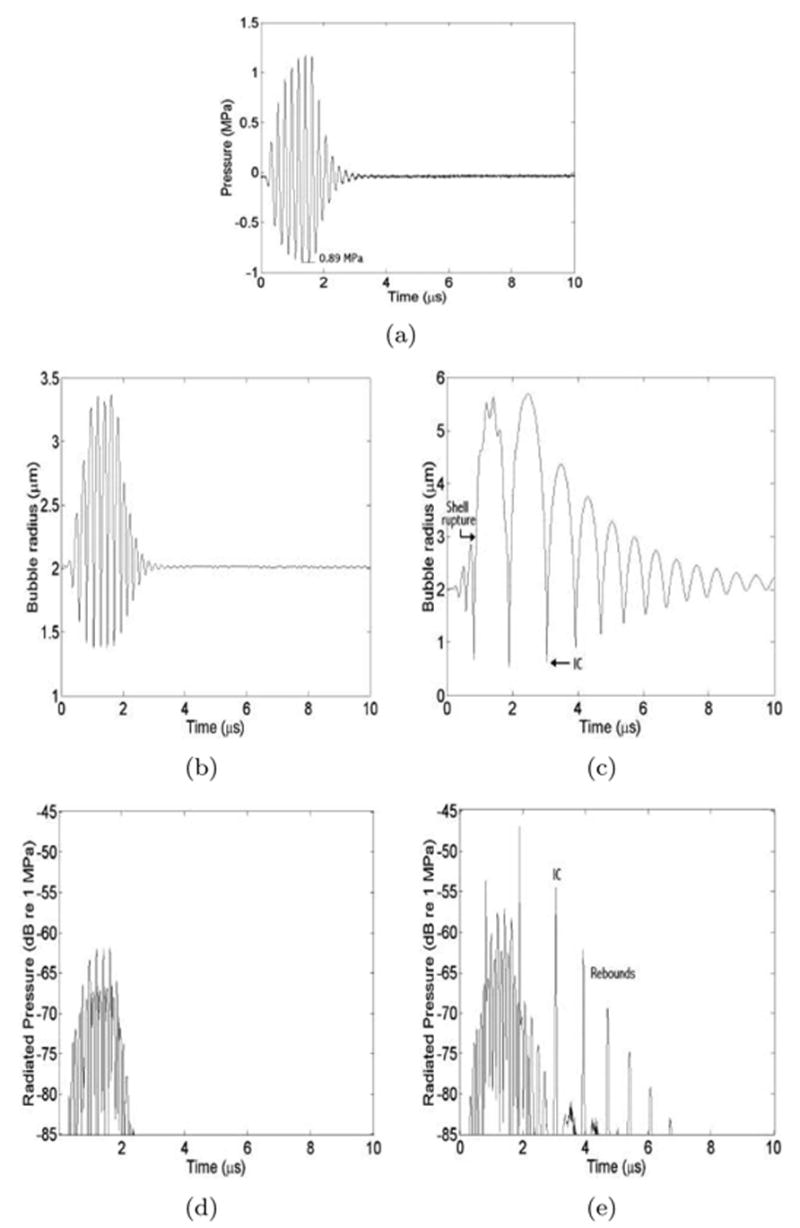
Determining the rupture pressure threshold of ultrasound contrast agent microbubbles has significant applications for contrast imaging, development of therapeutic agents, and evaluation of potential bioeffects. Using a passive cavitation detector, this work evaluates rupture based on acoustic emissions from single, encapsulated, gas-filled microbubbles. Sinusoidal ultrasound pulses were transmitted into weak solutions of Optison at different center frequencies (0.9, 2.8, and 4.6 MHz), pulse durations (three, five, and seven cycles of the center frequencies), and peak rarefactional pressures (0.07 to 5.39 MPa). Pulse repetition frequency was 10 Hz. Signals detected with a 13-MHz, center-frequency transducer revealed postexcitation acoustic emissions (between 1 and 5 micros after excitation) with broadband spectral content. The observed acoustic emissions were consistent with the acoustic signature that would be anticipated from inertial collapse followed by "rebounds" when a microbubble ruptures and thus generates daughter/free bubbles that grow and collapse. The peak rarefactional pressure threshold for detection of these emissions increased with frequency (e.g., 0.53, 0.87, and 0.99 MPa for 0.9, 2.8, and 4.6 MHz, respectively; five-cycle pulse duration) and decreased with pulse duration. The emissions identified in this work were separated from the excitation in time and spectral content, and provide a novel determination of microbubble shell rupture.
Figures


References
-
- Miller AP, Nanda NC. Contrast echocardiography: New agents. Ultrasound Med Biol. 2004;30:425–434. - PubMed
-
- Hohmann J, Albrecht T, Oldenburg A, Skrok J, Wolf KJ. Liver metastases in cancer: Detection with contrast-enhanced ultrasonography. Abdom Imaging. 2004;29:669–681. - PubMed
-
- Eyding J, Wilkening W, Reckhardt M, Schmid G, Meves S, Ermert H, Przuntek H, Postert T. Contrast burst depletion imaging (CODIM): A new imaging procedure and analysis method for semiquantitative ultrasonic perfusion imaging. Stroke. 2003;34:77–83. - PubMed
-
- Wei K, Jayaweera AR, Firoozan S, Linka A, Skyba DM, Kaul S. Quantification of myocardial blood flow with ultrasound-induced destruction of microbubbles administered as a constant venous infusion. Circulation. 1998;97:473–483. - PubMed
-
- Shohet RV, Chen S, Zhou YT, Wang Z, Meidell RS, Unger RH, Grayburn PA. Echocardiographic destruction of albumin microbubbles directs gene delivery to the myocardium. Circulation. 2000;101:2554–2556. - PubMed
Publication types
MeSH terms
Substances
Grants and funding
LinkOut - more resources
Full Text Sources
Other Literature Sources
