

High-resolution analysis of the surface P wave as a measure of atrial electrophysiological substrate
- PMID: 16472277
- PMCID: PMC6932038
- DOI: 10.1111/j.1542-474X.2006.00058.x
High-resolution analysis of the surface P wave as a measure of atrial electrophysiological substrate
Abstract
Background: At present atrial electrophysiology can only be assessed by invasive study. This limits available data in humans concerning atrial electrophysiologic changes in disease and in response to intervention. Indirect evidence suggests that the signal-averaged P wave (SAPW) may provide noninvasive markers of atrial electrophysiology but no direct evaluations that measure both refractoriness and conduction time have been reported.
Methods: We investigated 9 patients attending for diagnostic electrophysiological studies (4 male; mean age 35.7 years). A 20-pole catheter was positioned in the right atrium; a decapole catheter was placed in the coronary sinus. Atrial effective refractory period (AERP) and conduction times were measured at the lateral and septal right atrium and the left atrium during sinus rhythm (SR) and at pacing cycle lengths of 600, 500, and 400 ms. Simultaneous SAPW recordings were taken during SR and pacing at 600 ms. Intravenous flecainide (2 mg/kg) was given after which the protocol was repeated.
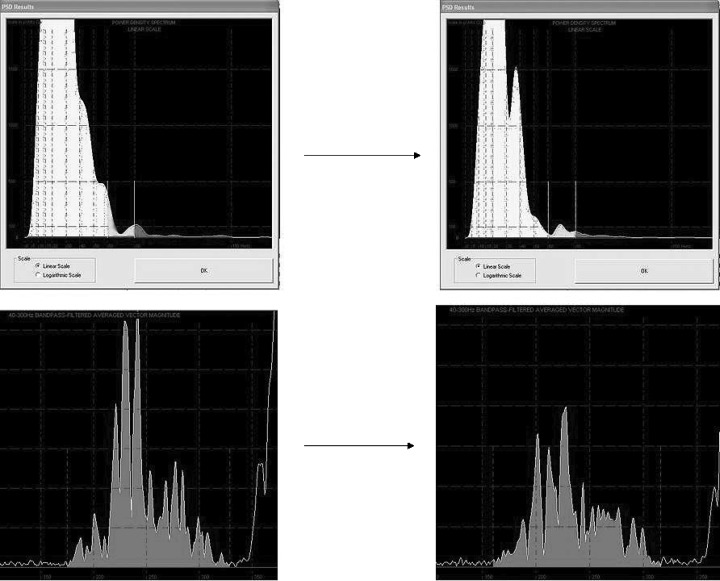
Results: Flecainide slowed conduction significantly at all sites (P < 0.05). During baseline measurements, rate adaptation of AERP was observed (P < 0.02 at the septum). Flecainide increased filtered P wave duration (P < 0.05) and reduced P wave energies (P < 0.05). Negative correlation was observed between P wave energies and conduction time with an inverse relationship between high-frequency energy and left atrial AERP.
Conclusions: The SAPW provides a noninvasive marker of atrial electrophysiology.
Figures
References
-
- Shimizu A, Centurion OA. Electrophysiological properties of the human atrium in atrial fibrillation [Review][129 refs]. Cardiovasc Res 2002;54: 302–314. - PubMed
-
- Jais P, Haissaguerre M, Shah DC, et al A focal source of atrial fibrillation treated by discrete radiofrequency ablation [see comments.]. Circulation 1997;95: 572–576. - PubMed
-
- Lau CP, Tse HF. Electrical remodelling of chronic atrial fibrillation [Review][17 refs]. Clin Exp Pharmacol Physiol 1997;24: 982–983. - PubMed
-
- Aytemir K, Aksoyek S, Ozer N, et al Atrial fibrillation after coronary artery bypass surgery: P wave signal averaged ECG, clinical and angiographic variables in risk assessment. Int J Cardiol 1999;69: 49–56. - PubMed
-
- Opolski G, Scislo P, Stanislawska J, et al Detection of patients at risk for recurrence of atrial fibrillation after successful electrical cardioversion by signal‐averaged P wave ECG. Int J Cardiol 1997;60: 181–185. - PubMed
MeSH terms
Substances
LinkOut - more resources
Full Text Sources
Research Materials
