. 2006 Feb 9;34(3):1015-27.
doi: 10.1093/nar/gkj488. Print 2006.

tRNA properties help shape codon pair preferences in open reading frames

Affiliations

tRNA properties help shape codon pair preferences in open reading frames

J Ross Buchan et al. Nucleic Acids Res. .

Abstract

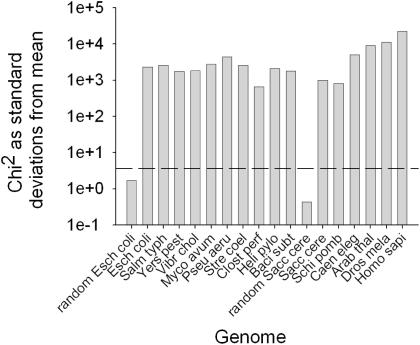
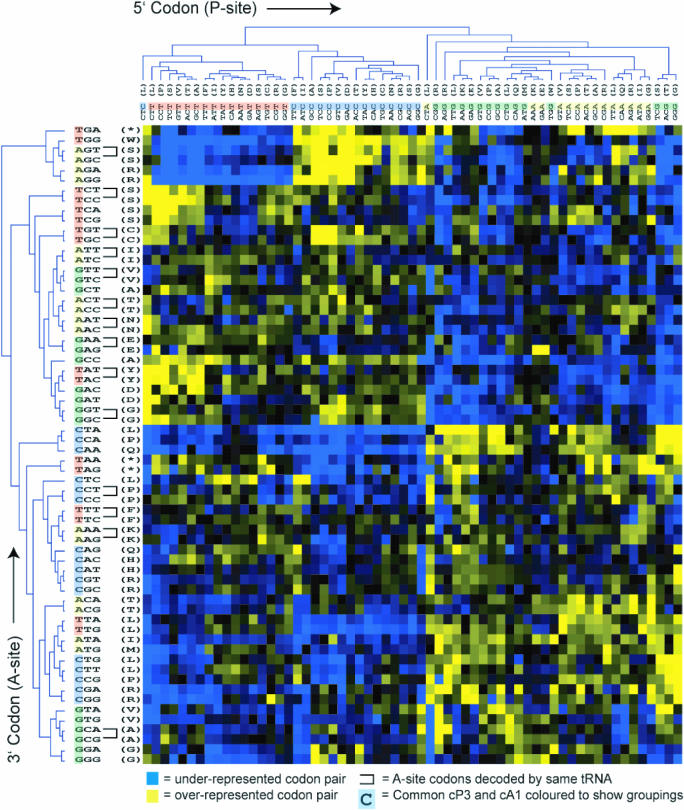
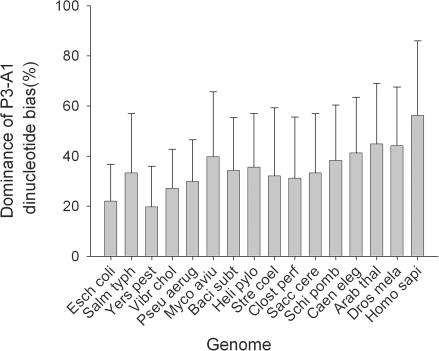
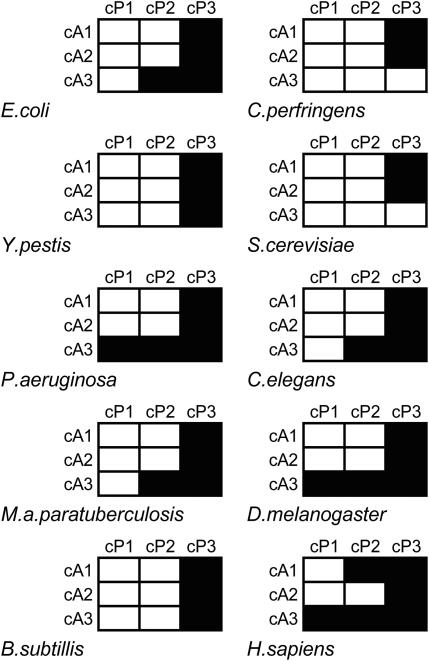
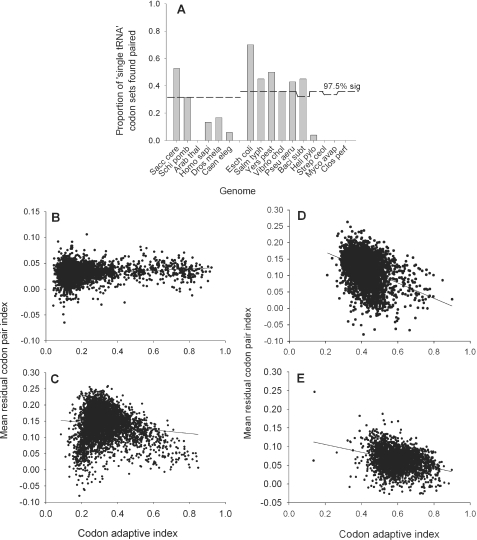
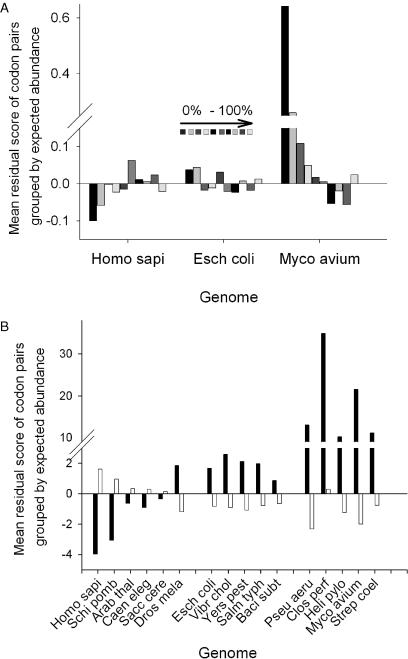
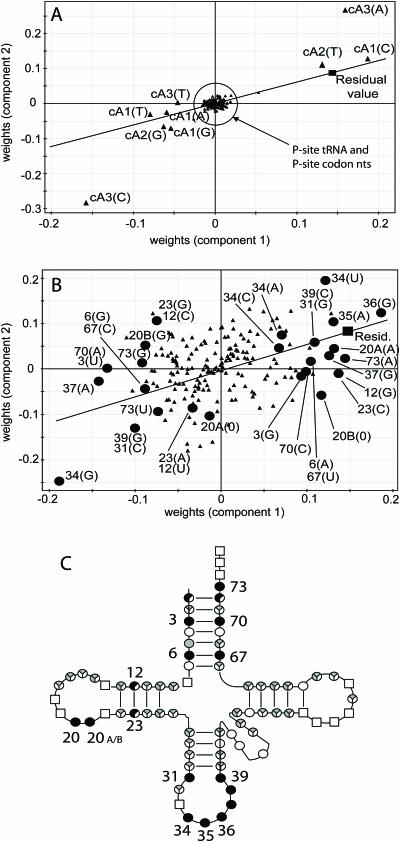
Translation elongation is an accurate and rapid process, dependent upon efficient juxtaposition of tRNAs in the ribosomal A- and P-sites. Here, we sought evidence of A- and P-site tRNA interaction by examining bias in codon pair choice within open reading frames from a range of genomes. Three distinct and marked effects were revealed once codon and dipeptide biases had been subtracted. First, in the majority of genomes, codon pair preference is primarily determined by a tetranucleotide combination of the third nucleotide of the P-site codon, and all 3 nt of the A-site codon. Second, pairs of rare codons are generally under-used in eukaryotes, but over-used in prokaryotes. Third, the analysis revealed a highly significant effect of tRNA-mediated selection on codon pairing in unicellular eukaryotes, Bacillus subtilis, and the gamma proteobacteria. This was evident because in these organisms, synonymous codons decoded in the A-site by the same tRNA exhibit significantly similar P-site pairing preferences. Codon pair preference is thus influenced by the identity of A-site tRNAs, in combination with the P-site codon third nucleotide. Multivariate analysis identified conserved nucleotide positions within A-site tRNA sequences that modulate codon pair preferences. Structural features that regulate tRNA geometry within the ribosome may govern genomic codon pair patterns, driving enhanced translational fidelity and/or rate.


Figures

<b>Figure 1</b>
Figure 1
Codon pair bias is highly significant in all genomes. The statistical significance of codon pair bias (the difference between observed and expected codon pair counts) in the range of genomes tested was assessed using χ2 analysis. On a semi-log plot, bars represent the number of standard deviations the ∑χ2 value lies from the mean. The dotted line indicates the number of standard deviations representing the 99.99% significance level. Species designations used comprise the first four letters of genus and species names, respectively.
<b>Figure 2</b>
Figure 2
Codon pair residual values for E.coli were represented on a 61 by 64 colour grid 5′, P-site codons occupy the horizontal axis and 3′, A-site codons the vertical axis. Each colour pixel represents a codon pair residual value. Over-represented codon pairs are represented in yellow, under-represented values in blue. Colour intensity range represents the full span of residual values. Average linkage clustering of codon pair residual values was used to group codon pairs according to their similarity, producing a dendrogram on each axis. Clustering was carried out on the P-site codons based on their similarity of pair preferences for 3′, A-site codons, and vice versa. Where groups of two A-site codons decoded by a single isoacceptor tRNA (mono-isoacceptor groups; MIGs) are clustered at the extremities of the tree (i.e. most similar to each other), they are linked by ‘U’-shaped bars (see text for details).
<b>Figure 3</b>
Figure 3
Dinucleotide bias at codon–codon junctions is not a dominant force shaping codon pair bias. Codon pair residuals in a range of genomes were grouped into 16 sets defined by the identity of the cP3-cA1 dinucleotide at the codon–codon junction. For each set, the ratio of under-represented: over-represented codon pairs was assessed and converted to an index representing the uniformity of residual value polarities for codon pairs sharing cP3-cA1 identity. The bar chart shows the average cP3-cA1 dinucleotide bias index for each genome. Error bars represent +/− 1 standard deviation (n = 16). Standard species designations were used (see Figure 1).
<b>Figure 4</b>
Figure 4
Codon pair preference is directed by combinations of nucleotides spanning adjacent codons. Codon pair residuals in a range of genomes were organized and grouped according to the identities of nucleotide couples composed of one P-site nucleotide, and one A-site nucleotide (e.g. cP1-cA1 or cP2-cA3). Within each of the nine dinucleotide-organized groups, observed and expected codon pair counts were used to calculate χ2 values for all 16 nt pair combinations. These were summed and the significance of the ∑χ2 value recorded. For a range of organisms, black grid cells indicate which of the 9 nt couple frequencies differed significantly from that expected (P = 0.001).
<b>Figure 5</b>
Figure 5
Codon pair preference is tRNA mediated in some genomes, but is poorly correlated with codon bias. The significance of A-site MIG codon clustering was statistically assessed (Materials and Methods). (A) For each organism, the proportion of all MIG codon groups (out of a total of between 20 and 25 depending on the tRNA isoacceptor complement for that species) found paired at tree extremities is represented in the bar chart. The dashed line represents the 2.5% confidence level for MIG codon associations assessed using a probability distribution of simulated pairings (Materials and Methods). (BE) The mean codon pair index value was calculated for each ORF in a range of genomes (Materials and methods), and plotted against the codon adaptive index for that ORF. A linear regression line was fitted to the dot plot using the computer program SigmaPlot (Systat software Inc.). (B) S.cerevisiae; (C) E.coli; (D) B.subtilis; (E) C.perfringens.
<b>Figure 6</b>
Figure 6
Prokaryote and eukaryote genomes are distinguished by distinct patterns of codon pair usage. For all genomes tested, the codon pair residual values (oenor/enor) were tabulated, ordered by expected frequency, and separated into 10 bins. For each bin, the mean residual value was calculated. (A) Mean residual values plotted for each of the 10 bins (0–10% bin is the left-most bar in each group of ten). (B) Residuals were further smoothed into two equal bins before averaging, one bin containing the expected 50% least abundant codon pairs (black bars), the other the expected 50% most abundant codon pairs (white bars).
<b>Figure 7</b>
Figure 7
Multivariate analysis of the tRNA sequence influence on codon pairing preference. PLS analysis was used to identify nucleotides in P and A-site tRNAs that were good predictors of codon pair residual values. Representative data (data subset in which cP3 = G) from the E.coli analysis is presented, split between panels A and B for ease of interpretation. The weights plots (A and B) shown report the quantitative relationship between the x predictor variables (tRNA nucleotides) and y dependent variable (codon pair residual), plotted for the two components used to model the data. On these plots, tRNA and codon nucleotides plotted close to the residual value plot position (filled square) are typically those associated with over-represented codon pairs. Conversely, those at the opposite end of a line that bisects the plot origin and residual value point are typically those associated with under-represented codon pairs. (A) PLS weights plot showing P- and A-site codon nucleotides together with P-site tRNA nucleotides (filled triangles) plotted versus the codon pair residual value (filled square). (B) A-site tRNA nucleotides (filled triangles) plotted versus the codon pair residual value (filled square). Filled circle symbols represent key A-site tRNA nucleotide positions indicated by the PLS analysis to be significant predictors of the residual value across three bacterial species tested. Influential A-site tRNA nucleotide positions (filled circles) are labelled with the standard cloverleaf model nucleotide position, and the nucleotide identity. (C) A cloverleaf model of the basic tRNA structure, indicating those positions on the tRNA that were identified as good predictors of the codon pair residual value. Positions identified as important for residual prediction in E.coli, P.aeruginosa and B.subtilis are indicated by filled circles, those important in either two or just one of the three organisms, as 2/3 and 1/3 filled circles, respectively. Sector shadings indicate positions where >40% (black) or <40% (grey) of nucleotide identities at a given position were influential, averaged across the three species. Open squares represent invariant nucleotides.

References

    1. Maaloe O., Kjeldgaard N.O. Control of macromolecular synthesis. NY: W.A. Benjamin, Inc.; 1966.
    1. Pedersen S. Escherichia coli ribosomes translate in vivo with variable rate. EMBO J. 1984;3:2895–2898. - PMC - PubMed
    1. Kruger M.K., Pedersen S., Hagervall T.G., Sorensen M.A. The modification of the wobble base of tRNAGlu modulates the translation rate of glutamic acid codons in vivo. J. Mol. Biol. 1998;284:621–631. - PubMed
    1. Boe L. Translational errors as the cause of mutations in Escherichia coli. Mol. Gen. Genet. 1992;231:469–471. - PubMed
    1. Toth M.J., Murgola E.J., Schimmel P. Evidence for a unique first position codon-anticodon mismatch in vivo. J. Mol. Biol. 1988;201:451–454. - PubMed

Publication types