. 2006 Feb 21;103(8):2898-903.
doi: 10.1073/pnas.0511005103. Epub 2006 Feb 10.

Frequency selectivity of synaptic exocytosis in frog saccular hair cells

Affiliations

Frequency selectivity of synaptic exocytosis in frog saccular hair cells

Mark A Rutherford et al. Proc Natl Acad Sci U S A. .

Abstract

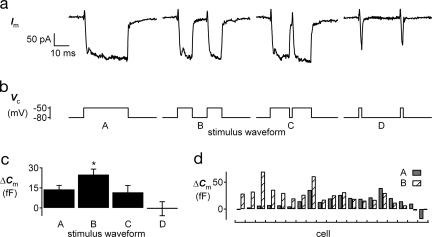
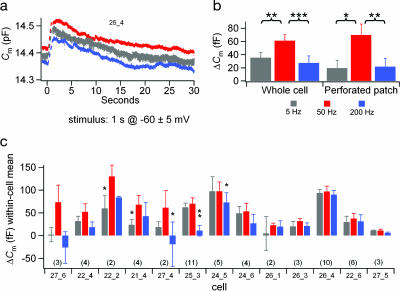
The ability to respond selectively to particular frequency components of sensory inputs is fundamental to signal processing in the ear. The frog (Rana pipiens) sacculus, which is used for social communication and escape behaviors, is an exquisitely sensitive detector of sounds and ground-borne vibrations in the 5- to 200-Hz range, with most afferent axons having best frequencies between 40 and 60 Hz. We monitored the synaptic output of saccular sensory receptors (hair cells) by measuring the increase in membrane capacitance (deltaC(m)) that occurs when synaptic vesicles fuse with the plasmalemma. Strong stepwise depolarization evoked an exocytic burst that lasted 10 ms and corresponded to the predicted capacitance of all docked vesicles at synapses, followed by a 20-ms delay before additional vesicle fusion. Experiments using weak stimuli, within the normal physiological range for these cells, revealed a sensitivity to the temporal pattern of membrane potential changes. Interrupting a weak depolarization with a properly timed hyperpolarization increased deltaC(m). Small sinusoidal voltage oscillations (+/-5 mV centered at -60 mV) evoked a deltaC(m) that corresponded to 95 vesicles per s at each synapse at 50 Hz but only 26 vesicles per s at 5 Hz and 27 vesicles per s at 200 Hz (perforated patch recordings). This frequency selectivity was absent for larger sinusoidal oscillations (+/-10 mV centered at -55 mV) and was largest for hair cells with the smallest sinusoidal-stimuli-evoked Ca2+ currents. We conclude that frog saccular hair cells possess an intrinsic synaptic frequency selectivity that is saturated by strong stimuli.


Conflict of interest statement

Conflict of interest statement: No conflicts declared.

Figures

Fig. 1.
Fig. 1.
SV pools and ΔCm in whole-cell recordings from frog saccular hair cells. In these and all other whole-cell experiments, the intracellular Ca2+ buffer was 1 mM EGTA. (a) The SB is surrounded by docked (green) and nondocked (purple) SVs. “Afferent” labels a postsynaptic terminal. (Scale bar, 200 nm.) (b) Representative Cm traces for depolarizations to −20 mV lasting 10 ms (small response) or 200 ms (large response). We did not attempt to interpret Cm measurements during the depolarization-induced changes in membrane conductance, which have been blanked during the interval from the onset of the depolarization until 30 ms after Vm was returned to −80 mV (dashed lines). (c) Boxed region from b. Cm(t) was averaged in 100-ms windows (red) surrounding the blanked interval, and the difference was used to compute ΔCm. (d) ΔCm plotted as a function of step duration. Each point is the average ΔCm for the first depolarization applied to each cell (mean ± SEM; n shown in parentheses; each cell contributed one ΔCm value at one duration only; total, n = 66 cells). There was no significant difference for any pairwise comparison of means at 10, 25, 30, and 50 ms (see Table 2, which is published as supporting information on the PNAS web site). Green and purple dashed lines indicate estimated numbers of docked SVs and docked plus undocked SVs, respectively, that are associated with synaptic ribbons. (e) Mean Ca2+ influx during the stimuli in d. Data are for whole-cell, voltage-clamp recordings. Evidence for the Ca2+ dependence of ΔCm and the ensemble-averaged Cm(t) traces for the data in d are shown in Figs. 8, 9b, and 10, which are published as supporting information on the PNAS web site.
Fig. 2.
Fig. 2.
Interposed hyperpolarization can increase ΔCm. (a) Representative ICa during the four stimulus patterns shown in b. Each cell received patterns A and B, plus one or more of the other patterns. (b) Stimuli AD are steps to −55 mV, except in a few cells in which the ΔCm responses to stimuli A and B were too small to measure, in which case the depolarization was increased to −50 mV. Step timing: stimulus A, 30 ms; stimulus B, 2 × 10 ms separated by 10 ms; stimulus C, 2 × 14 ms separated by 2 ms; stimulus D, 2 × 2 ms separated by 26 ms. (c) Mean ΔCm responses (±SEM) to the four stimulus patterns. The response to stimulus B was significantly larger than all others (see text). An alternative analysis in which the ΔCm responses in each cell were first normalized by the ΔCm response to stimulus waveform B gave similar results. (d) Individual ΔCm from the 19 cells receiving stimulus patterns A and B. Responses to the first stimulus presentation are shown for waveforms A (solid gray bars) and B (striped bars).
Fig. 3.
Fig. 3.
ΔCm responses to sinusoidal stimulation at 5 (gray), 50 (red), and 200 (blue) Hz. Each cell received either weak (±5 mV centered at −60 mV, solid bars) or strong (±10 mV centered at −55 mV, striped bars) stimulation for 1 s at each frequency with 30 s between stimuli. Presentation order was randomized among cells from the six possibilities. The strong stimuli were delivered around a more depolarized baseline than the weak stimuli to mimic the asymmetric transduction current in these cells (45). To avoid possible rundown effects, only responses to the first presentation of the three frequencies are included in this figure. (a) Vm and leak-subtracted Im from one representative whole-cell recording. (b) Total Ca2+ influx did not differ across frequencies (same cells as d). (c) Ensemble-averaged Rs (Upper) and Cm (Lower) for all weak stimuli (same cells as d). (d) For weak stimuli (whole-cell, n = 11 cells), ΔCm at 50 Hz was significantly greater (55 ± 12 fF) than at 5 Hz (20 ± 10 fF, P = 0.0001) or 200 Hz (18 ± 12 fF, P = 0.008). No significant differences between frequencies were observed for strong stimuli (whole-cell, n = 5 cells). (e and f) Similar results were obtained from perforated-patch recordings (n = 11 cells; only the weak stimuli were used). ΔCm at 50-Hz stimuli (76 ± 17 fF) was significantly greater than ΔCm at 5 Hz (26 ± 14 fF, P = 0.014) or 200 Hz (20 ± 13 fF, P = 0.006).
Fig. 4.
Fig. 4.
Correlation of ICa amplitude during weak sinusoidal stimulation with the frequency selectivity of ΔCm. Combined whole-cell and perforated-patch data. (a) Representative current traces from one cell that had a large ICa and one cell that had a small ICa. (b) To quantify the preference for 50 Hz in each cell, we divided the ΔCm at 50 Hz by the mean ΔCm at all three frequencies and correlated this measure with the mean integrated Ca2+ influx across frequencies for perforated-patch (gray inverted triangle) and whole-cell (black inverted triangle) recordings. The regression line and correlation coefficient are shown.
Fig. 5.
Fig. 5.
Frequency selectivity in individual cells. ΔCm responses from the subset of cells in Fig. 3, from which two or more stimulus presentations were delivered at each frequency. Sinusoidal stimuli were delivered for 1 s in a fixed order within each cell (e.g., 5, 50, 200, 5, 50, 200, and so on) and randomized between cells, with a 30-s interstimulus interval. (a) Averaged Cm traces for 10 stimulus presentations at each frequency to one cell (perforated-patch recording) collected over 15 min. (b) Means (±SEM) of within-cell means. Whole cell (n = 11): ΔCm at 50 Hz (61 ± 9 fF) was significantly greater than at 5 Hz (35 ± 8 fF, P = 0.001) and 200 Hz (27 ± 11 fF, P = 0.0006); perforated patch (n = 11): ΔCm at 50 Hz (70 ± 17 fF) was significantly greater than at 5 Hz (19 ± 12 fF, P = 0.012) and 200 Hz (20 ± 12 fF, P = 0.006). (c) Within-cell ΔCm means (±SEM, number of repetitions in parentheses) are plotted across frequencies for 13 cells. Ensemble-averaged Cm(t) traces for two cells are shown in Fig. 10, which is published as supporting information on the PNAS web site.
Fig. 6.
Fig. 6.
Steep voltage sensitivity of Im and ΔCm. Continuous recording of Vm, Im, and Cm in a cell that was presented with a series of sinusoidal voltage oscillations (50 Hz, ±5 mV, 10-s duration, 10 s between stimuli) centered at −70, −65, −60, and −55 mV (see also Fig. 7). (Inset) Enlargement of stimulus response (Vm) and current response (Im) around the onset of the −60 ± 5 mV stimulus. The Vm oscillation during the rest period that ends at t = 65 ms appears as a broad black band in Vm and is the result of the 1.5-kHz probe from the lock-in amplifier, which is turned off during the 50-Hz stimulation.

References

    1. Fettiplace R., Fuchs P. A. Ann. Rev. Physiol. 1999;61:809–834. - PubMed
    1. Bruns V., Goldbach M. Anat. Embryol. Hist. Arch. 1980;161:51–63. - PubMed
    1. Purgue A. P., Narins P. M. J. Comp. Physiol. A. 2000;186:481–488. - PubMed
    1. Armstrong C. E., Roberts W. M. J. Neurosci. 1998;18:2962–2973. - PMC - PubMed
    1. Martin P., Bozovic D., Choe Y., Hudspeth A. J. J. Neurosci. 2003;23:4533–4548. - PMC - PubMed

Publication types