. 2006 Mar;18(3):639-50.
doi: 10.1105/tpc.105.038315. Epub 2006 Feb 10.

FLOWERING LOCUS C mediates natural variation in the high-temperature response of the Arabidopsis circadian clock

Affiliations

FLOWERING LOCUS C mediates natural variation in the high-temperature response of the Arabidopsis circadian clock

Kieron D Edwards et al. Plant Cell. 2006 Mar.

Abstract

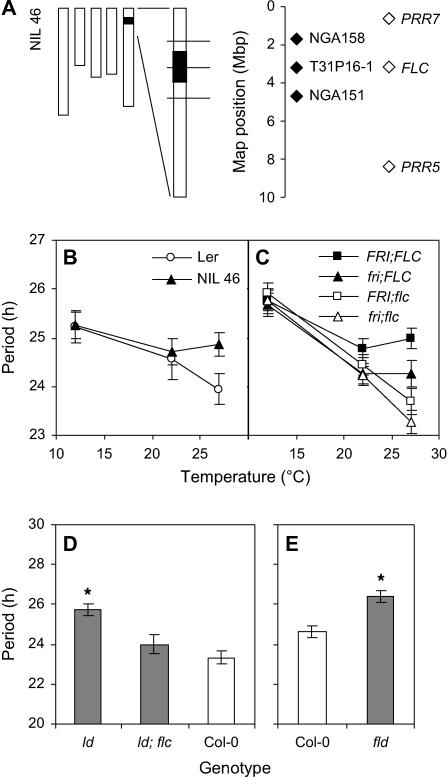
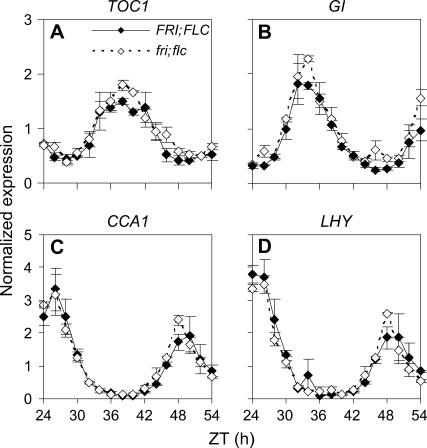
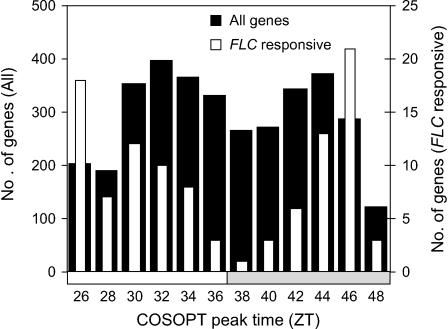
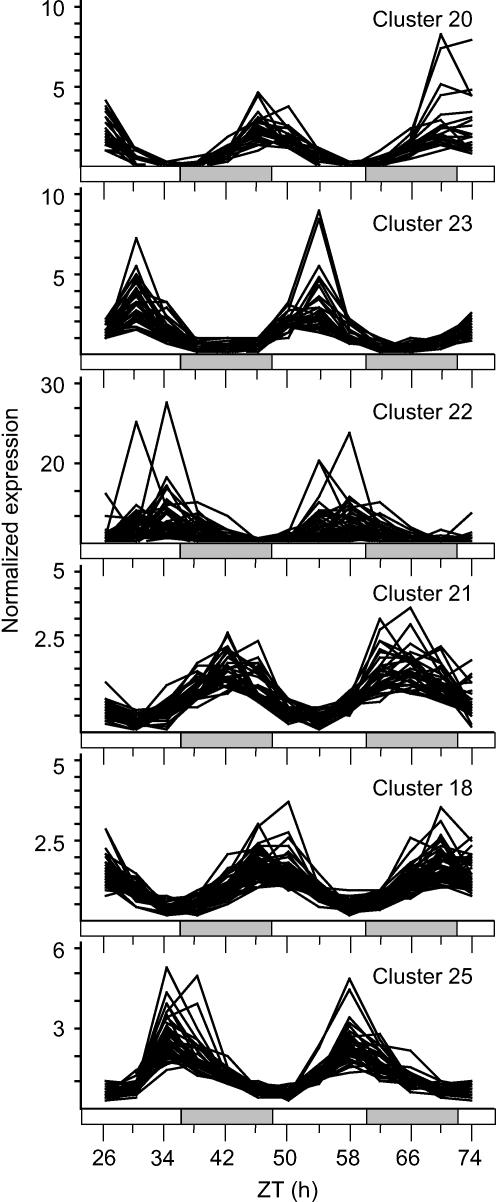
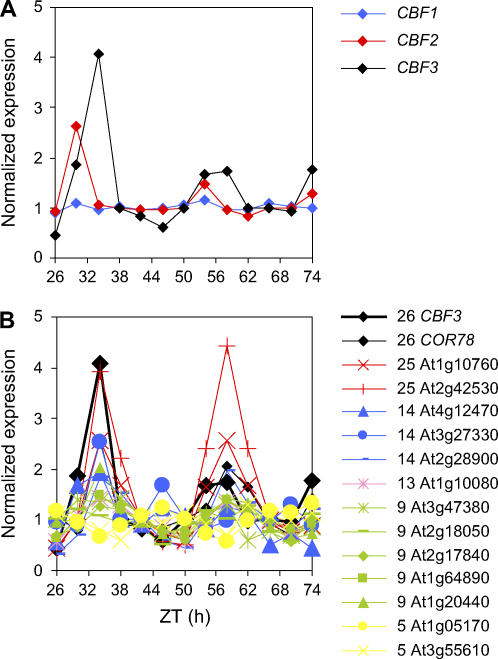
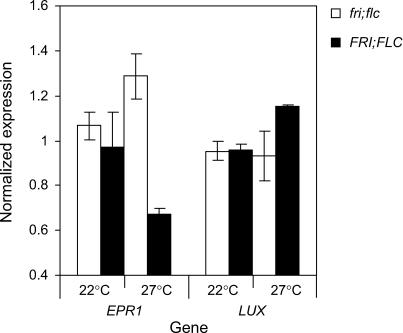
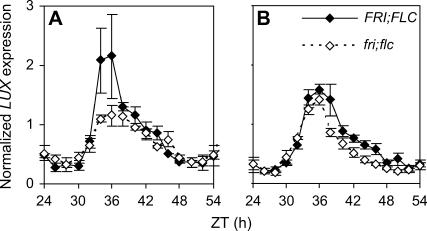
Temperature compensation contributes to the accuracy of biological timing by preventing circadian rhythms from running more quickly at high than at low temperatures. We previously identified quantitative trait loci (QTL) with temperature-specific effects on the circadian rhythm of leaf movement, including a QTL linked to the transcription factor FLOWERING LOCUS C (FLC). We have now analyzed FLC alleles in near-isogenic lines and induced mutants to eliminate other candidate genes. We showed that FLC lengthened the circadian period specifically at 27 degrees C, contributing to temperature compensation of the circadian clock. Known upstream regulators of FLC expression in flowering time pathways similarly controlled its circadian effect. We sought to identify downstream targets of FLC regulation in the molecular mechanism of the circadian clock using genome-wide analysis to identify FLC-responsive genes and 3503 transcripts controlled by the circadian clock. A Bayesian clustering method based on Fourier coefficients allowed us to discriminate putative regulatory genes. Among rhythmic FLC-responsive genes, transcripts of the transcription factor LUX ARRHYTHMO (LUX) correlated in peak abundance with the circadian period in flc mutants. Mathematical modeling indicated that the modest change in peak LUX RNA abundance was sufficient to cause the period change due to FLC, providing a molecular target for the crosstalk between flowering time pathways and circadian regulation.


Figures

Figure 1.
Figure 1.
FLC Alters the Period of the Clock in a Temperature-Dependent Manner. (A) NIL46 summary map showing the five Arabidopsis chromosomes and an expanded view of the top of Chromosome 5. Genotype of chromosomal regions is displayed graphically for Ler (white) and Cvi (black), with recombination break points indicated at the midpoint between molecular markers. Position of molecular markers (closed diamonds) and clock-related genes (open diamonds) are shown at right. The leaf movement period of NIL46 and Ler (B) and the fri and flc single and double mutant combinations (C) were assayed at 12, 22, and 27°C. Symbols are indicated in inset legends. Bars represent se. Leaf movement period of ld, ld; flc (D), and fld (E) mutants along with wild-type Col-0 seedlings at 27°C. Bars represent variance-weighted se of period estimates. Asterisks (D) and (E) indicate t test P value < 0.05 compared with Col-0.
Figure 2.
Figure 2.
Temporal Expression of Clock Genes in the FRI; FLC and fri; flc Genotypes at 27°C. The temporal pattern in transcript abundance of the clock genes TOC1 (A), GI (B), CCA1 (C), and LHY (D) was analyzed by real-time PCR in FRI; FLC (closed diamonds) and fri; flc (open diamonds) genotype seedlings. Expression levels for each gene were normalized to the average for the fri; flc genotype with respect to ACTIN2 (ACT2). Data shown are the average of two biological replicates, with error bars representing the range.
Figure 3.
Figure 3.
Distribution of COSOPT Peak Phases. Microarray time course expression profiles of Arabidopsis genes were scored for circadian rhythmicity with the program COSOPT. Phase estimates for all rhythmic genes (pMMC-β <0.05; closed bars) and rhythmic FLC-responsive genes (open bars) were binned into 2-h intervals. The number of genes was plotted for each bin, labeled with the lower period bound of the bin. Primary y axis (left) represents total number of genes and secondary axis (right) represents number of FLC-responsive genes. The bar on the x axis represents subjective day (white) and night (gray).
Figure 4.
Figure 4.
Bayesian Clustering of Rhythmic Genes. BFC was applied to microarray time course data to identify rhythmic genes. Graphs in vertical order showing expression profiles of genes in the six clusters scored with the highest amplitude. Cluster numbers are shown in the top right of each graph. Bars on x axes represent subjective day (white) and night (gray). The full analysis results are available from www.amillar.org.
Figure 5.
Figure 5.
Phase and Amplitude of BFC-Identified Clusters. Polar plot of phase versus amplitude for each of the rhythmic clusters identified. Clusters are represented by their identity numbers (as in Table 3). Phase estimates for clusters are shown clockwise in italics around the circumference from ZT26 to ZT50, and amplitudes are shown in italics on the radial axis. Size of cluster identity numbers represents number of genes in each cluster. Subjective night (gray) and day (white) represented by the band around the outside of the plot.
Figure 6.
Figure 6.
Circadian Expression of CBF Genes and Their Targets. Microarray expression profiles of CBF1 (blue), CBF2 (red), and CBF3 (black) genes (A) plus CBF3 and CBF target genes (identified in Fowler and Thomashow, 2002) in BFC clusters (B). See keys to right of graphs for gene identification. Cluster numbers shown as prefix to Arabidopsis Genome Initiative numbers in keys (B) and gene profiles colored by cluster.
Figure 7.
Figure 7.
EPR1 and LUX Expression in the FRI; FLC Genotypes. The average expression of EPR1 and LUX was analyzed by real-time PCR in pooled samples for FRI; FLC (closed bars) and fri; flc (open bars) genotype seedlings at 22 and 27°C. Expression levels for each gene are based on the average of two independent biological replicates and normalized to the average for all samples with respect to ACT2. Error bars show range of the replicates.
Figure 8.
Figure 8.
FLC Alters the Peak Level of LUX in a Temperature-Specific Manner. The temporal pattern in LUX transcript abundance was analyzed by real-time PCR in FRI; FLC (closed diamonds) and fri; flc (open diamonds) genotype seedlings at 27°C (A) and at 22°C (B). LUX expression levels were normalized with respect to ACT2, and the average for the fri; flc genotype at each temperature across ZT32 to ZT40 was set to 1. Data shown are the average of two to three biological replicates, with technical triplicates (see Methods). Error bars represent se.
Figure 9.
Figure 9.
Modeling the Effect of LUX on the Clock. Graph showing temporal expression of X (mRNA abundance) for fri; flc (dashed line) and FRI; FLC (solid line) genotypes as predicted by the model by Locke et al. (2005b). Initial parameters were taken from this model, and maximum transcription rate of X mRNA was increased by 10% under constant light conditions to simulate the increased peak expression of LUX mRNA in the FRI; FLC genotype compared with fri; flc. This resulted in a 1.6-h increase to free running period of the model.

References

    1. Akhtar, R.A., Reddy, A.B., Maywood, E.S., Clayton, J.D., King, V.M., Smith, A.G., Gant, T.W., Hastings, M.H., and Kyriacou, C.P. (2002). Circadian cycling of the mouse liver transcriptome, as revealed by cDNA microarray, is driven by the suprachiasmatic nucleus. Curr. Biol. 12 540–550. - PubMed
    1. Alabadi, D., Oyama, T., Yanovsky, M.J., Harmon, F.G., Mas, P., and Kay, S.A. (2001). Reciprocal regulation between TOC1 and LHY/CCA1. Science 293 880–883. - PubMed
    1. Anderson, P.E., Smith, J.Q., Edwards, K.D., and Millar, A.J. (2005). Bayesian Clustering and Model Exploration. (Coventry, UK: University of Warwick).
    1. Bastow, R., Mylne, J.S., Lister, C., Lippman, Z., Martienssen, R.A., and Dean, C. (2004). Vernalization requires epigenetic silencing of FLC by histone methylation. Nature 427 164–167. - PubMed
    1. Berriz, G.F., King, O.D., Bryant, B., Sander, C., and Roth, F.P. (2003). Characterizing gene sets with FuncAssociate. Bioinformatics 19 2502–2504. - PubMed

Publication types

MeSH terms